Lab
- Year
- 2012
- Type
- Data visualisation
A week of taxis
One week of taxi trips through the city, visualised hour by hour.
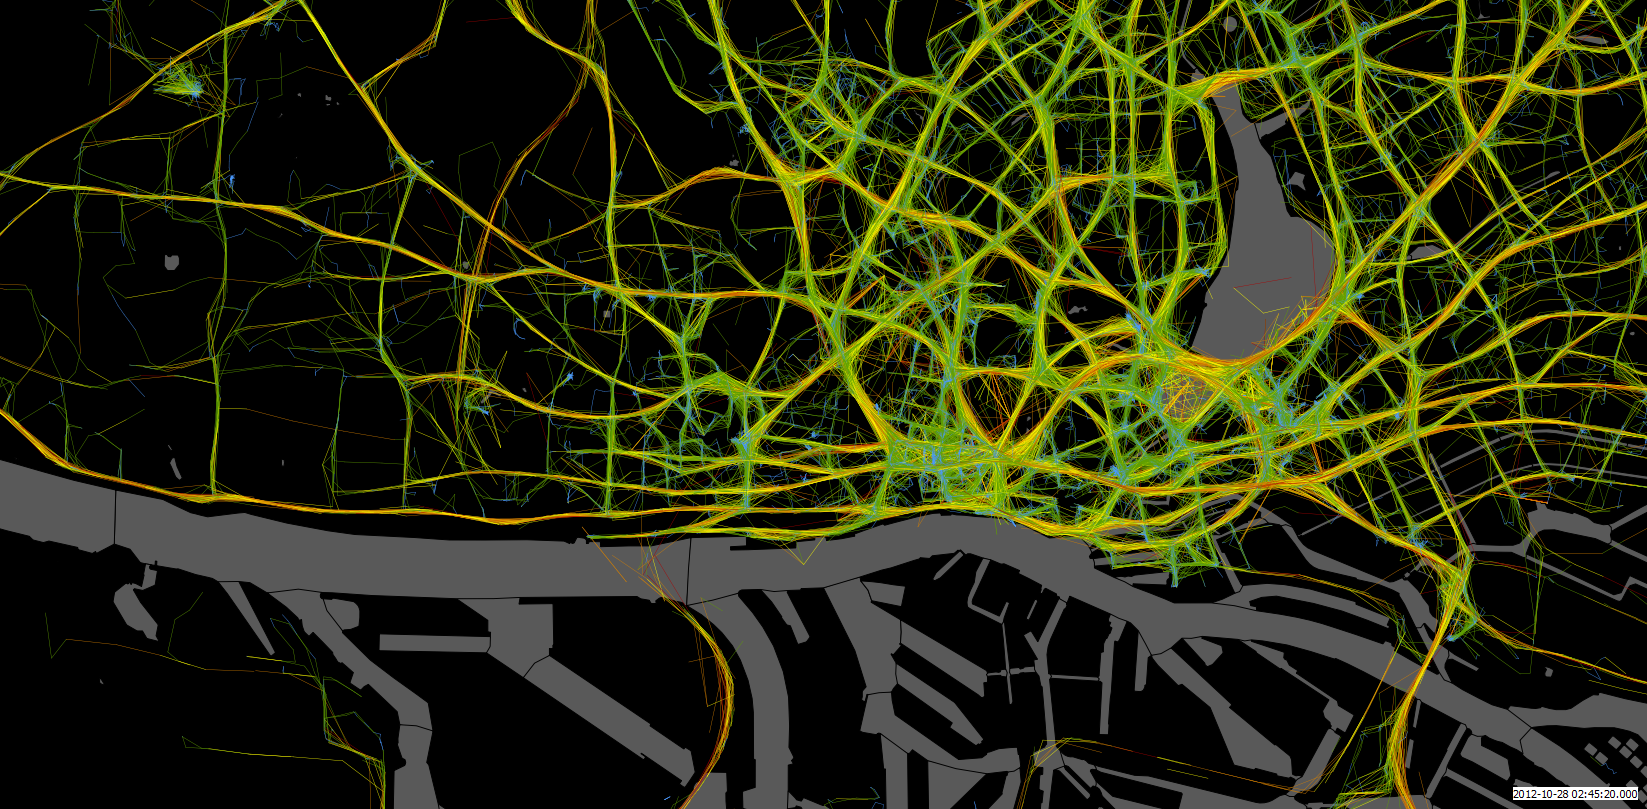
A small scraping project: for one week in October 2012 I recorded the positions of taxis in several cities, using data from a popular taxi-ordering website. A Python script collected the data, a PostGIS database stored it, and I made the maps, charts and videos with QGIS and VirtualDub.
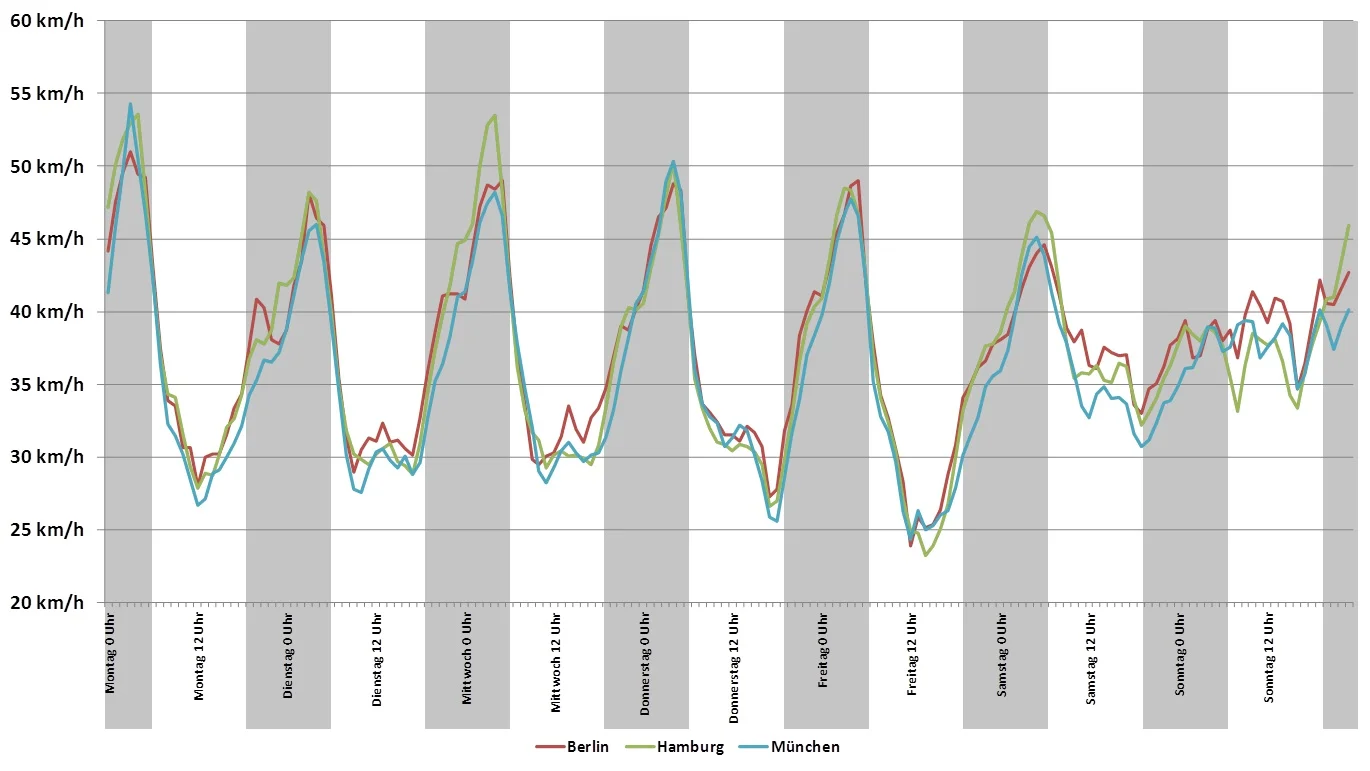
The maps show the speeds the taxis drove. Played as an animation, they show the rhythm of the city: congested streets light up at rush hour. Comparing average speeds across cities shows that each city keeps much the same daily rhythm.