- Year
- 2021
- Type
- Maps
#30DayMapChallenge 2021
one map a day for every day in November – most of them about public transport in Hamburg
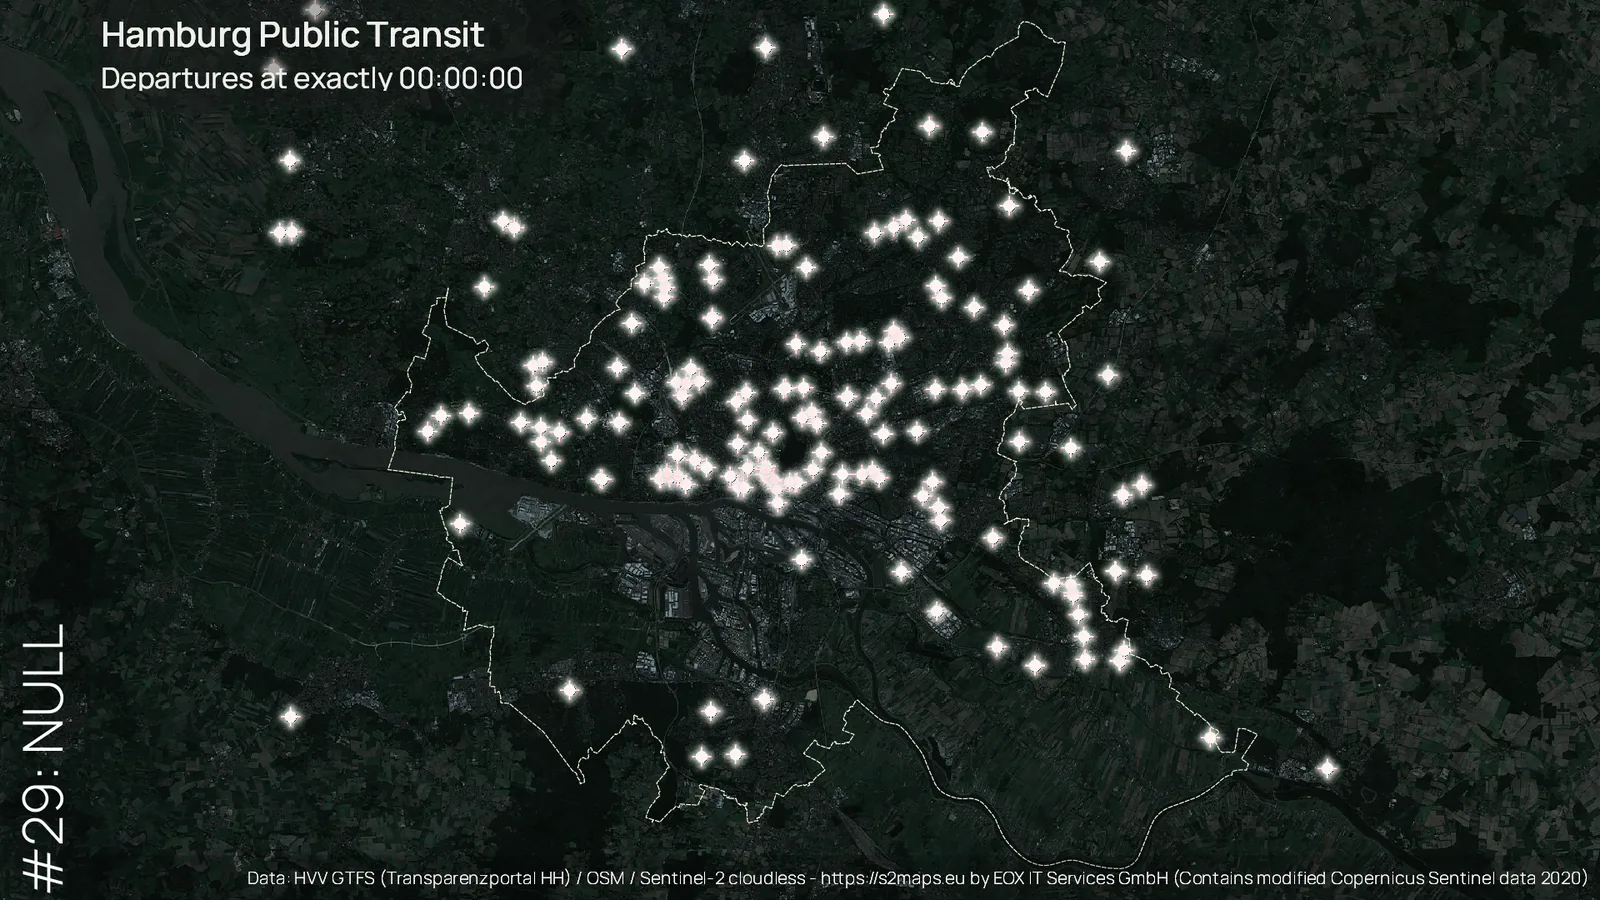
Starting in 2019, Finnish cartographer Topi Tjukanov called for a challenge to publish a map for each day in November based on a theme he had specified. In 2021, I participated and in addition to his topics took on the theme of public transport in Hamburg.
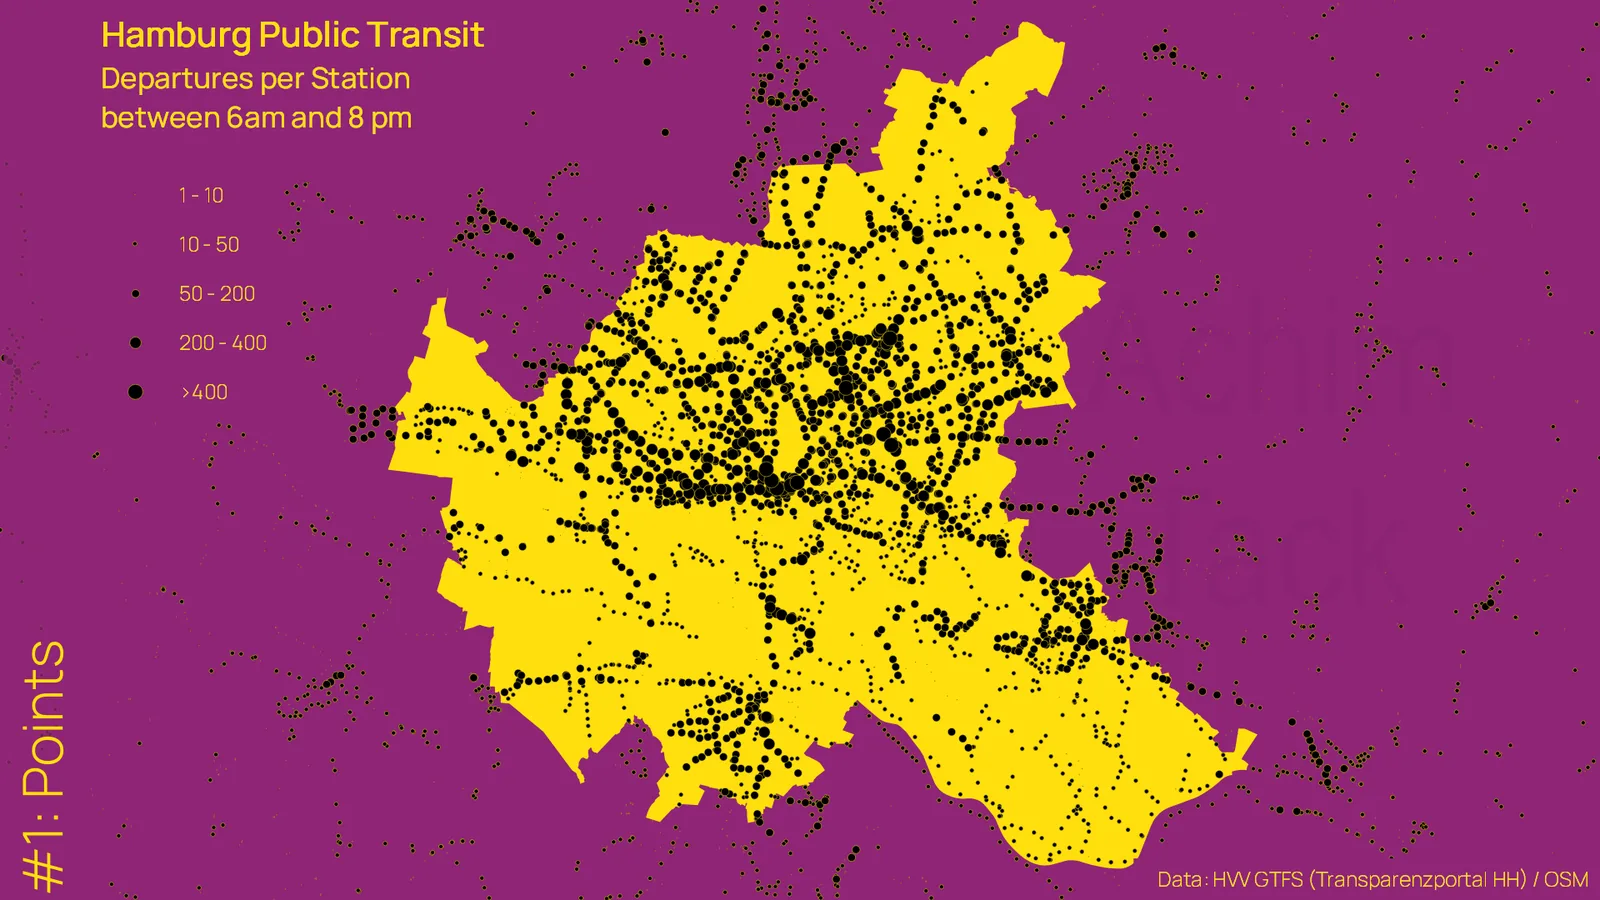
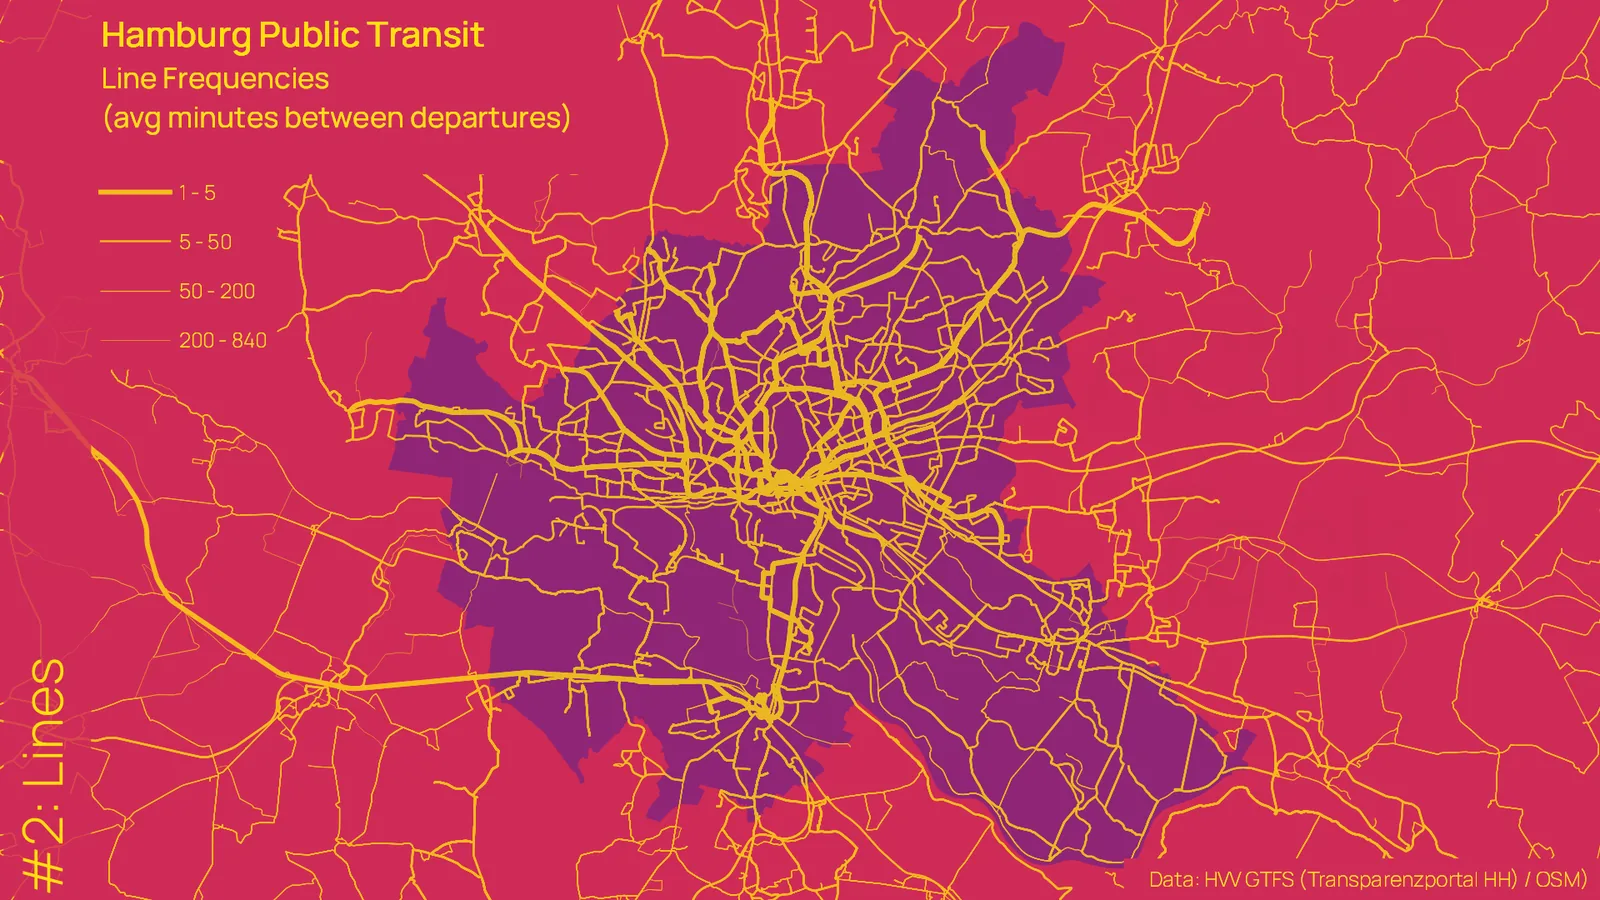
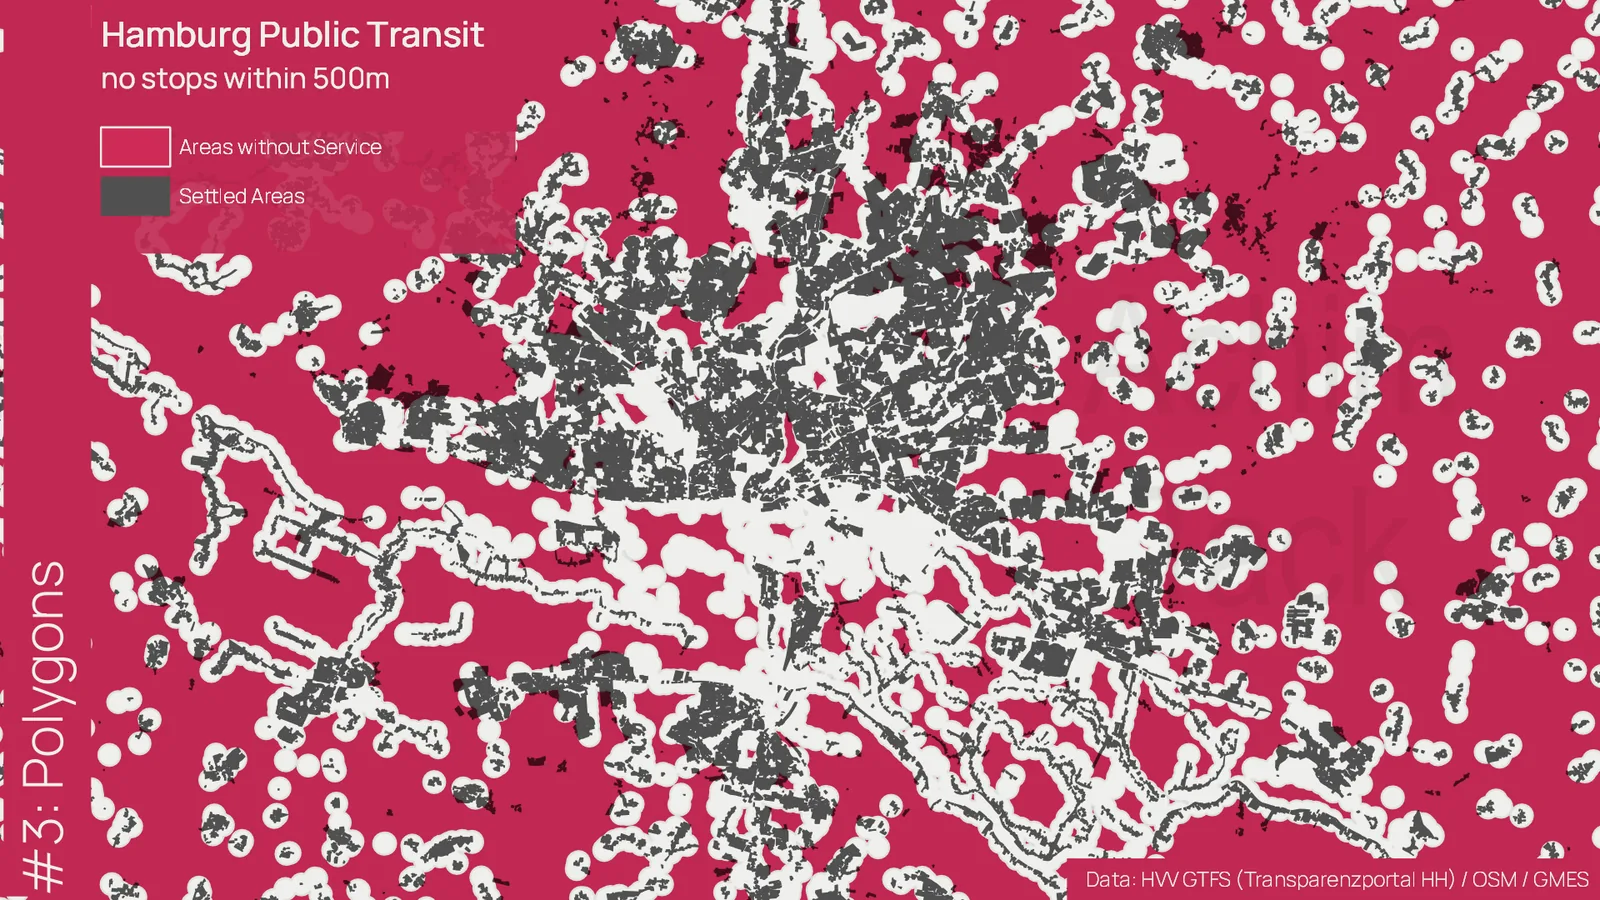
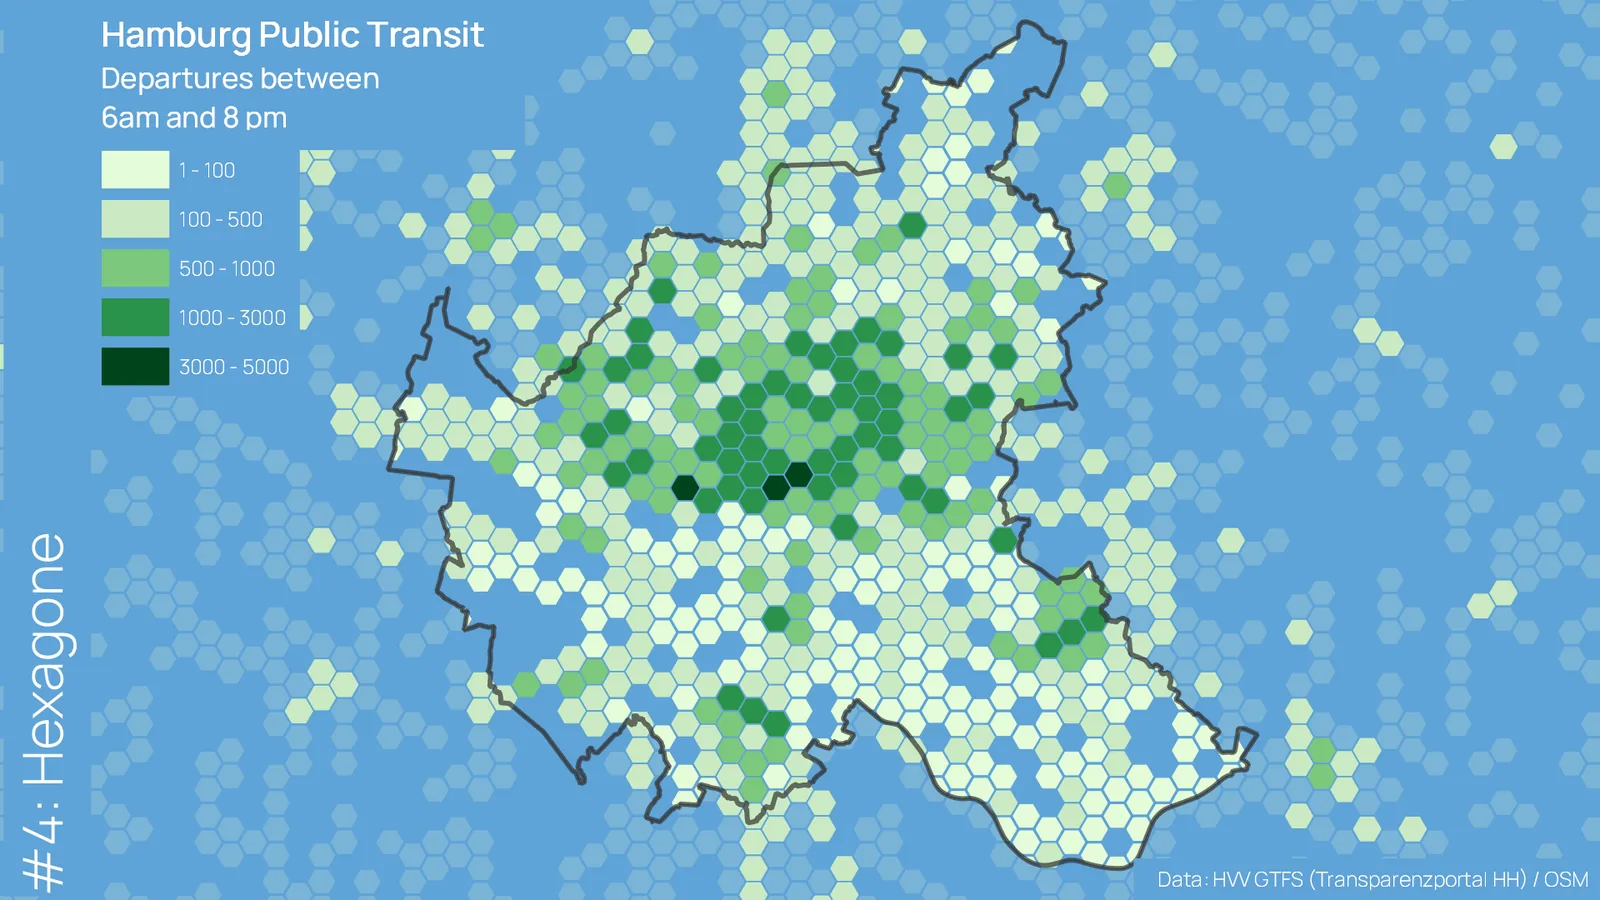
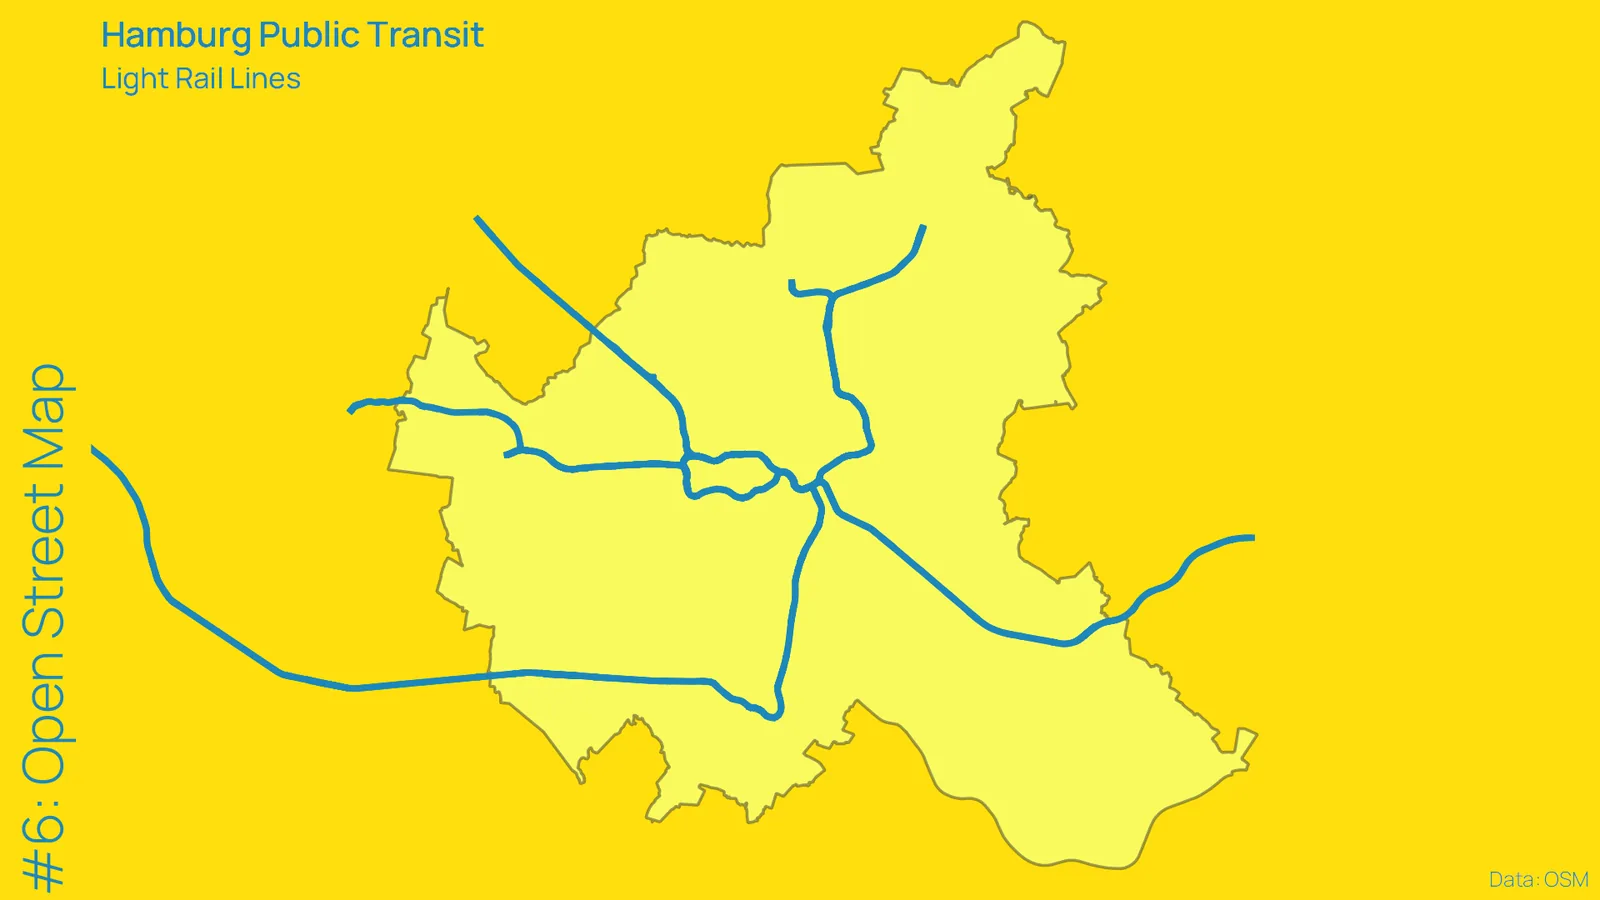
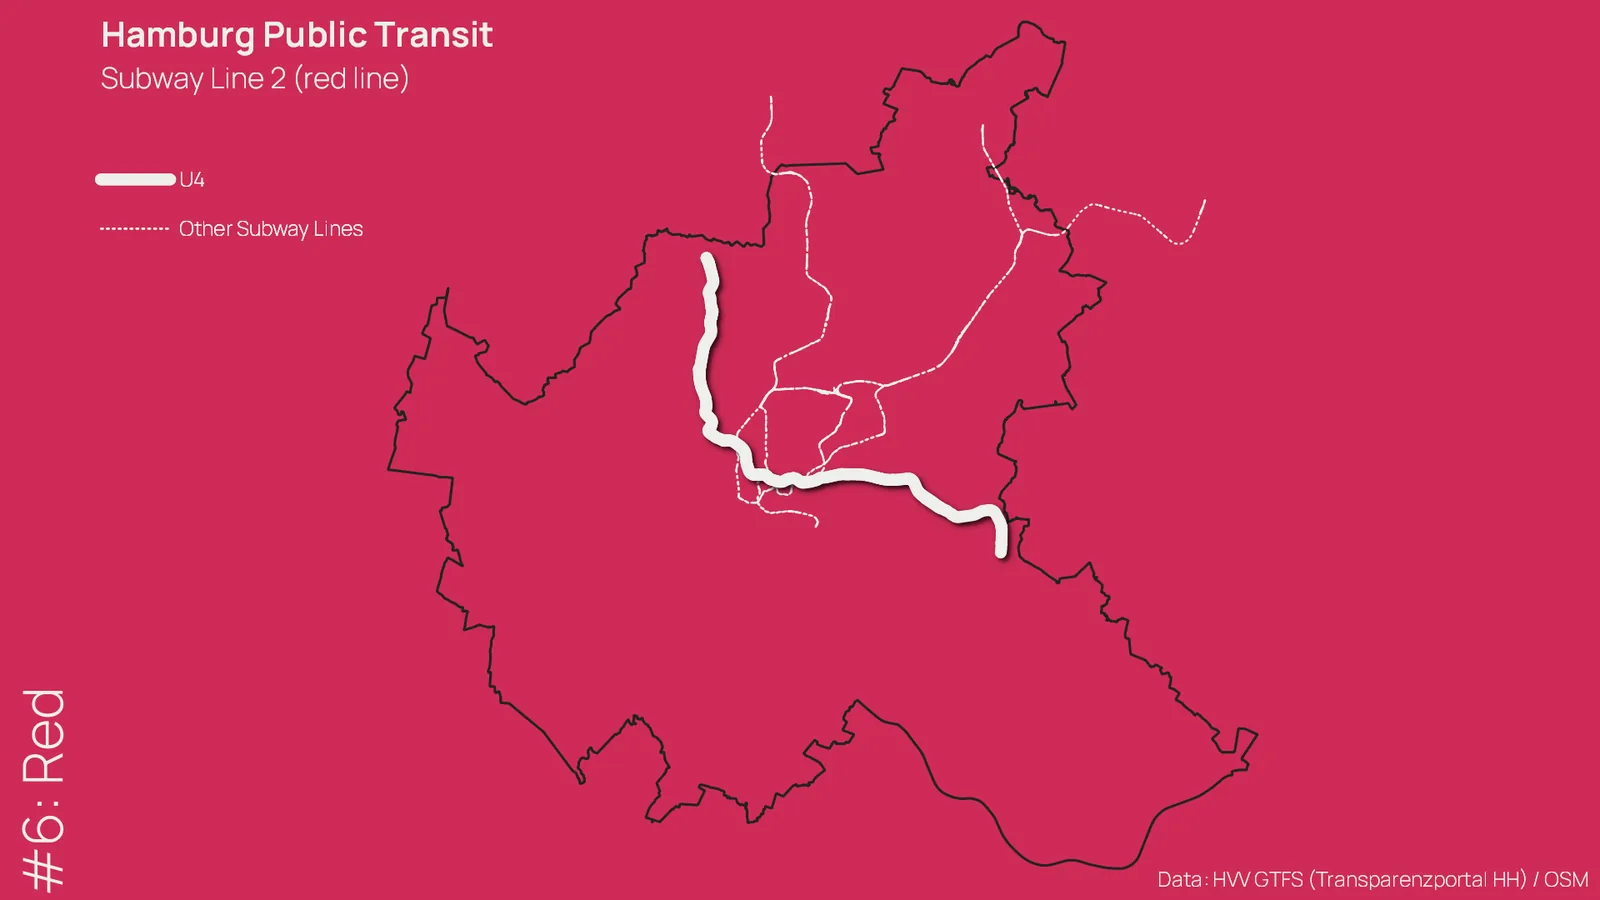
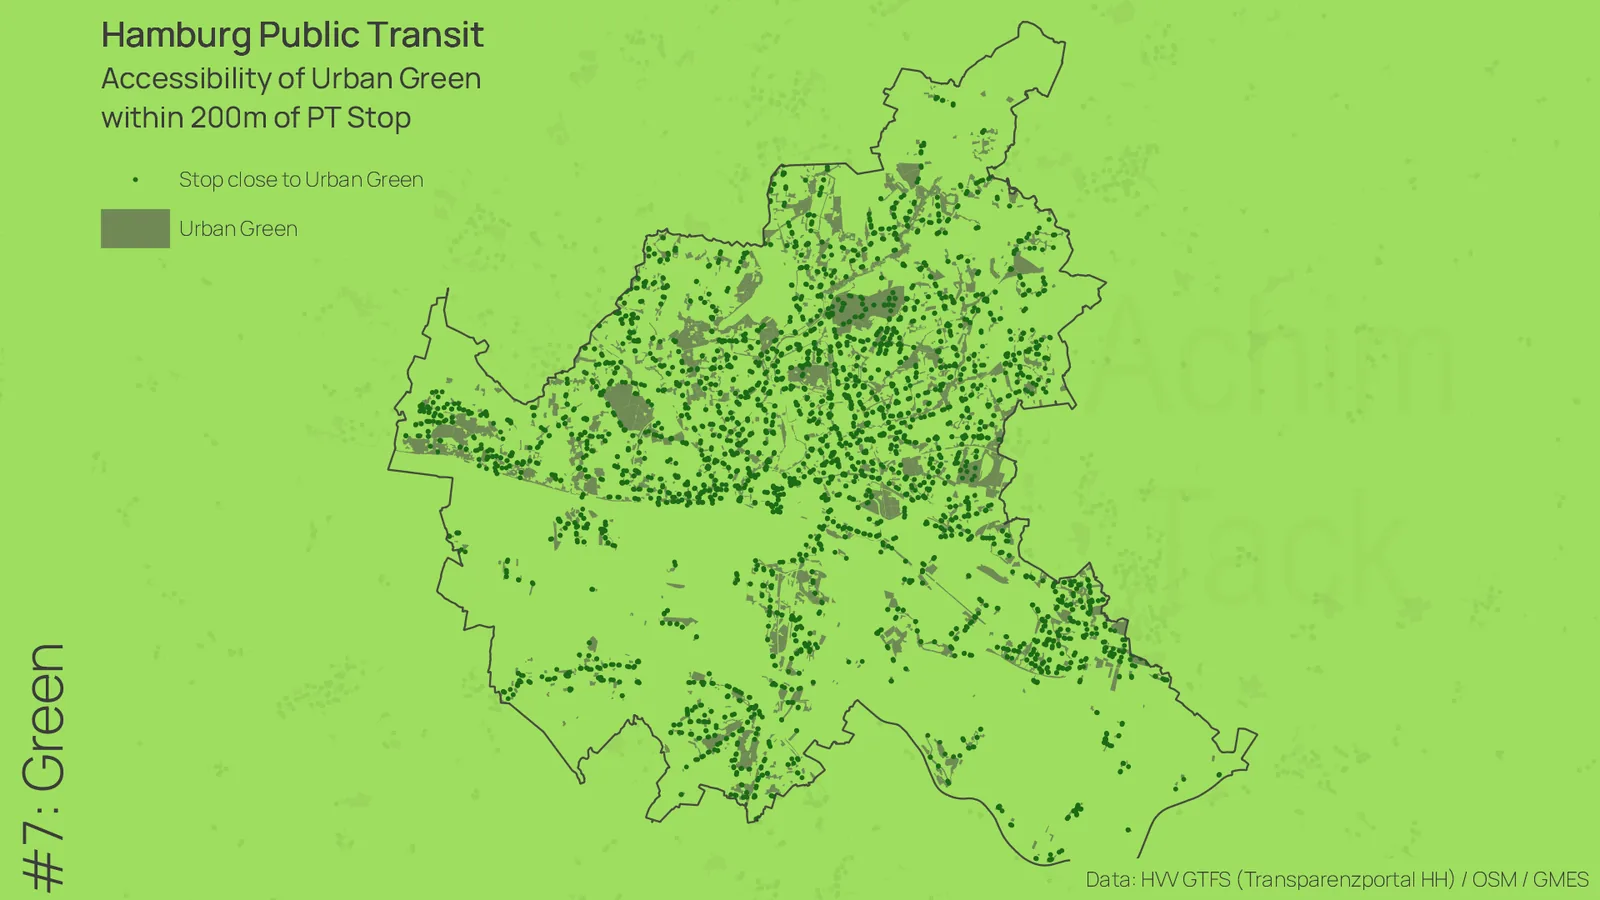
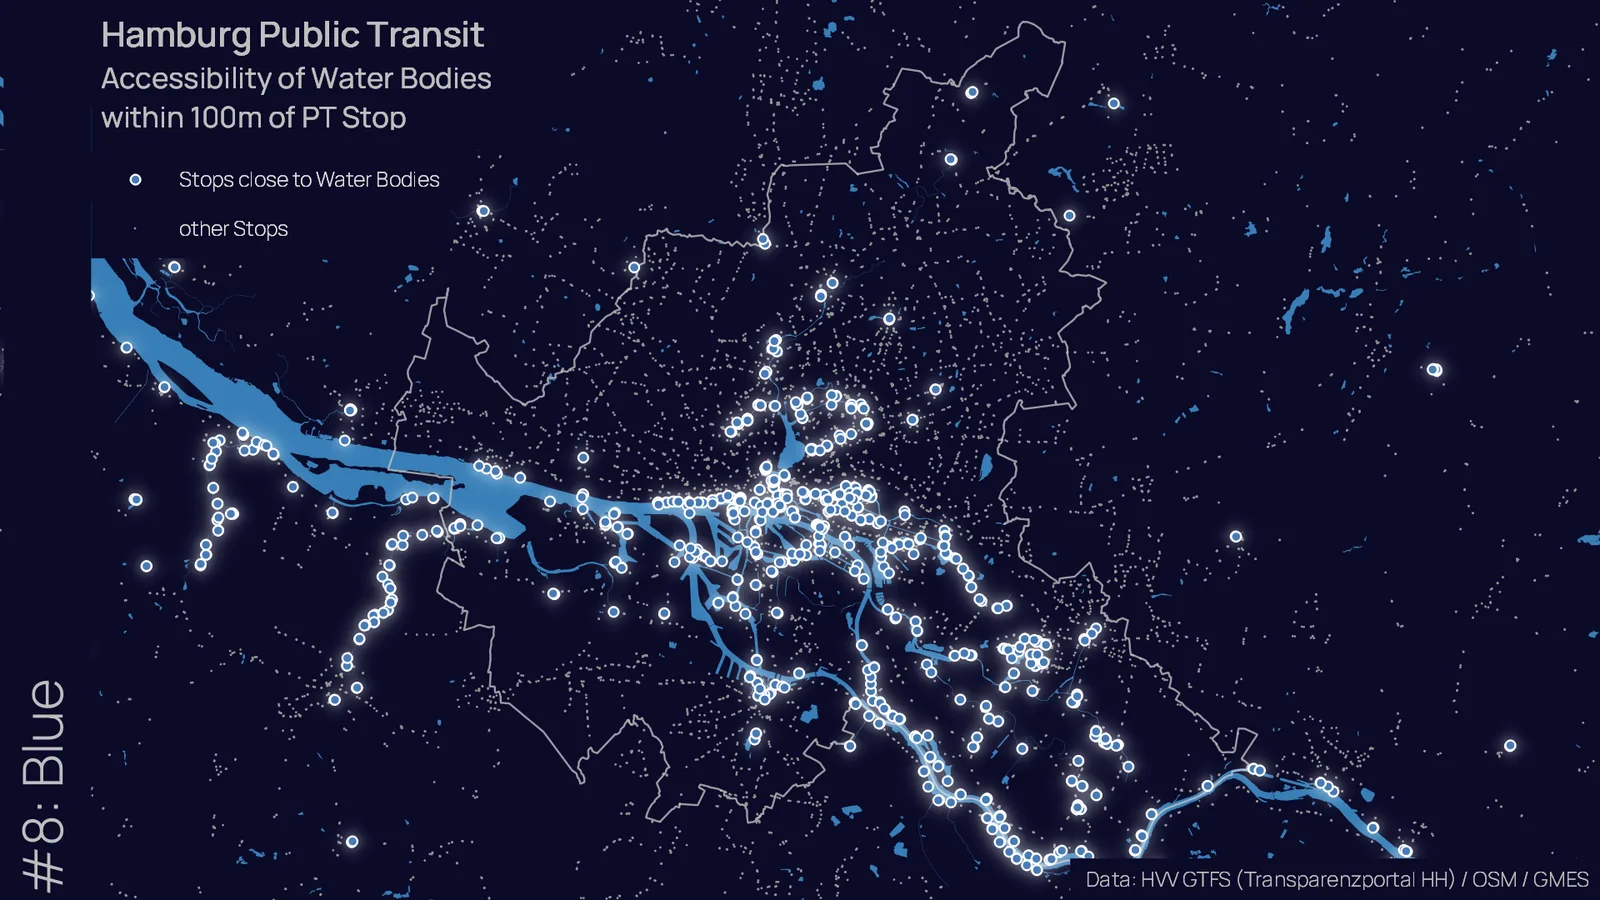
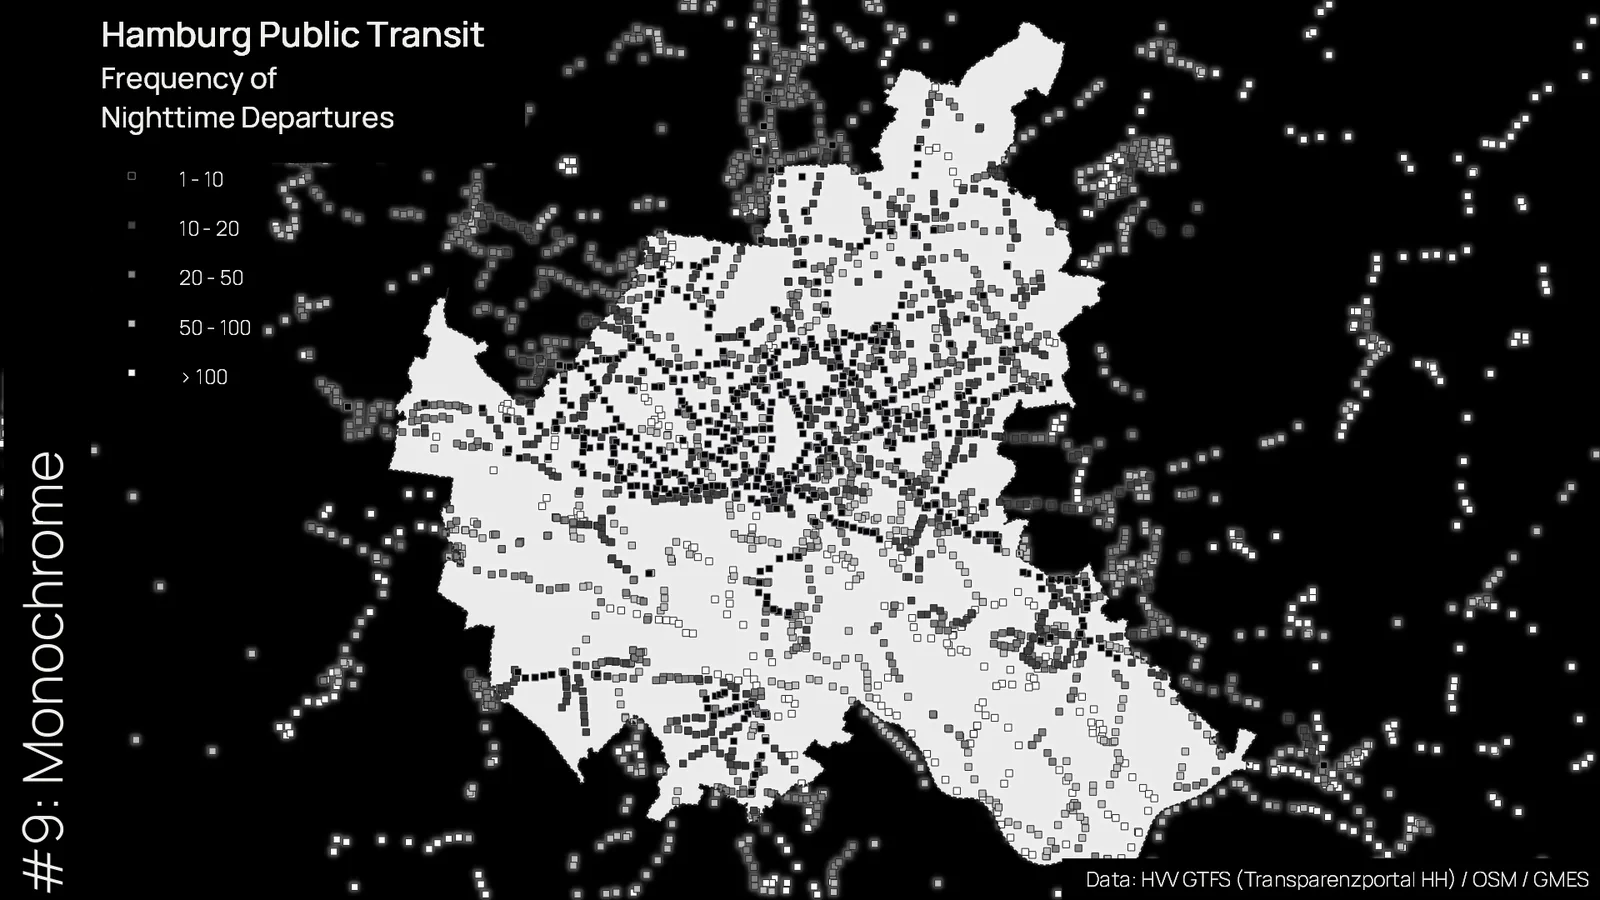
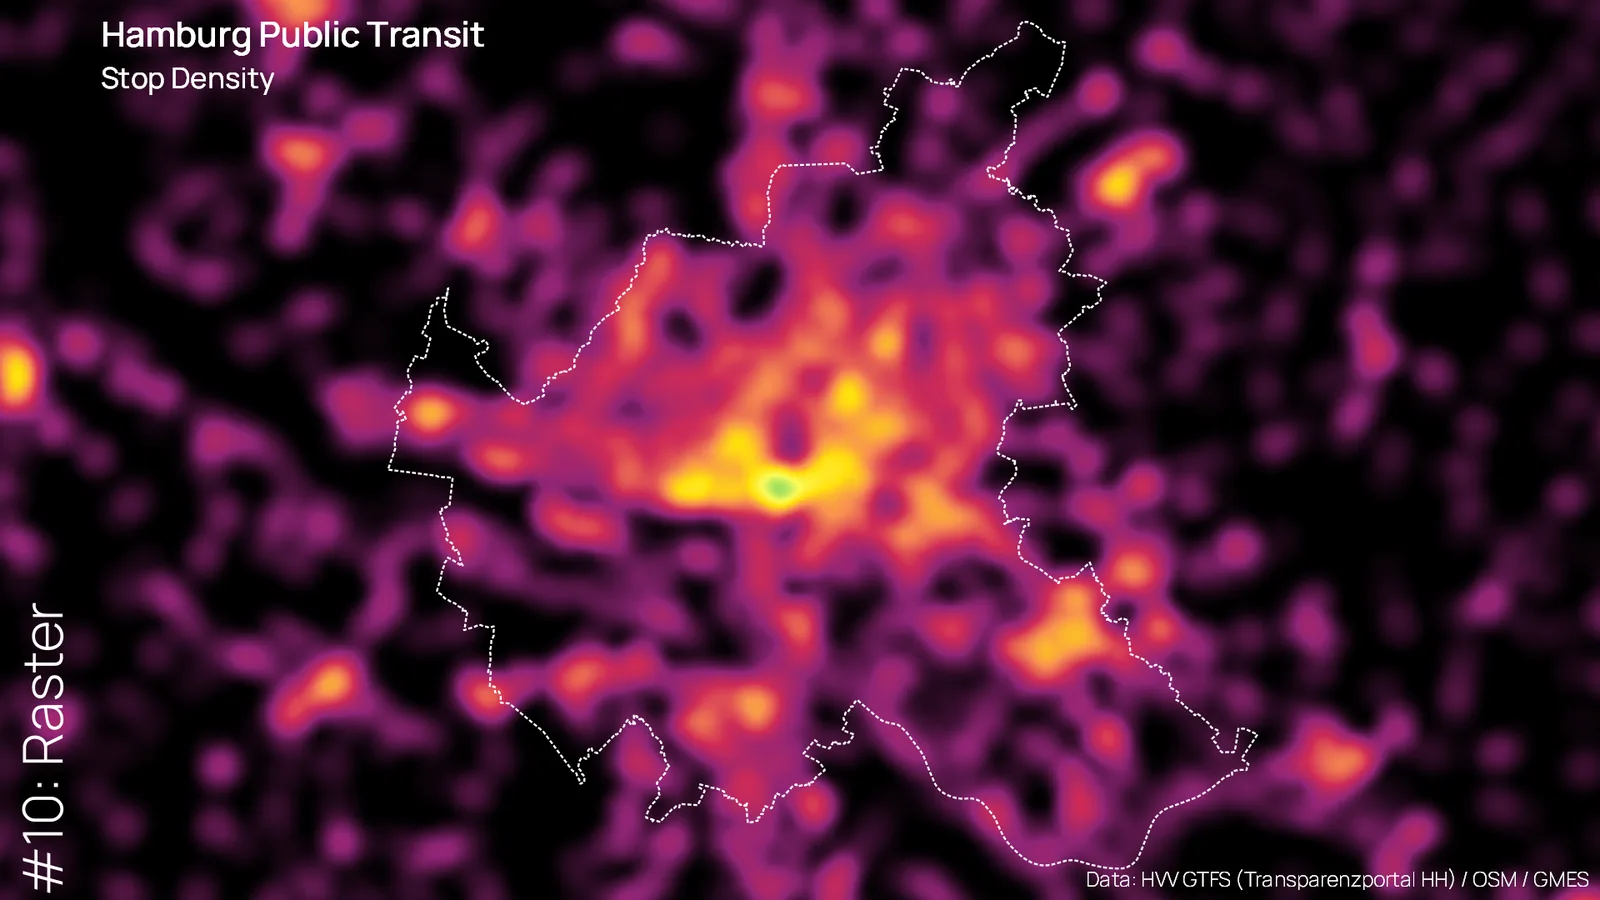
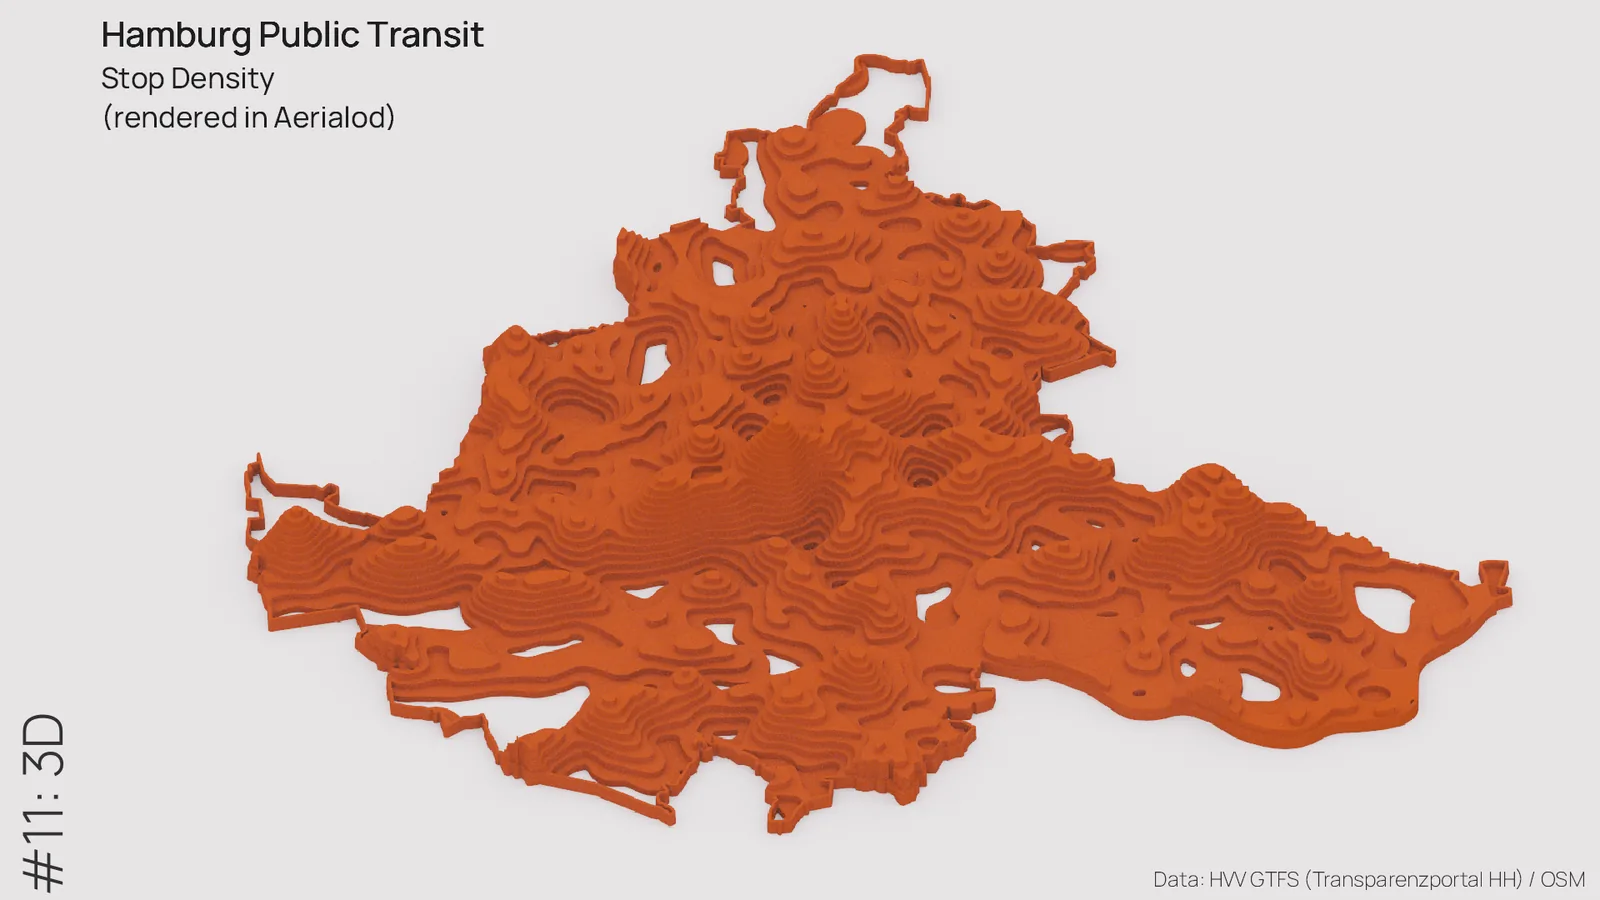
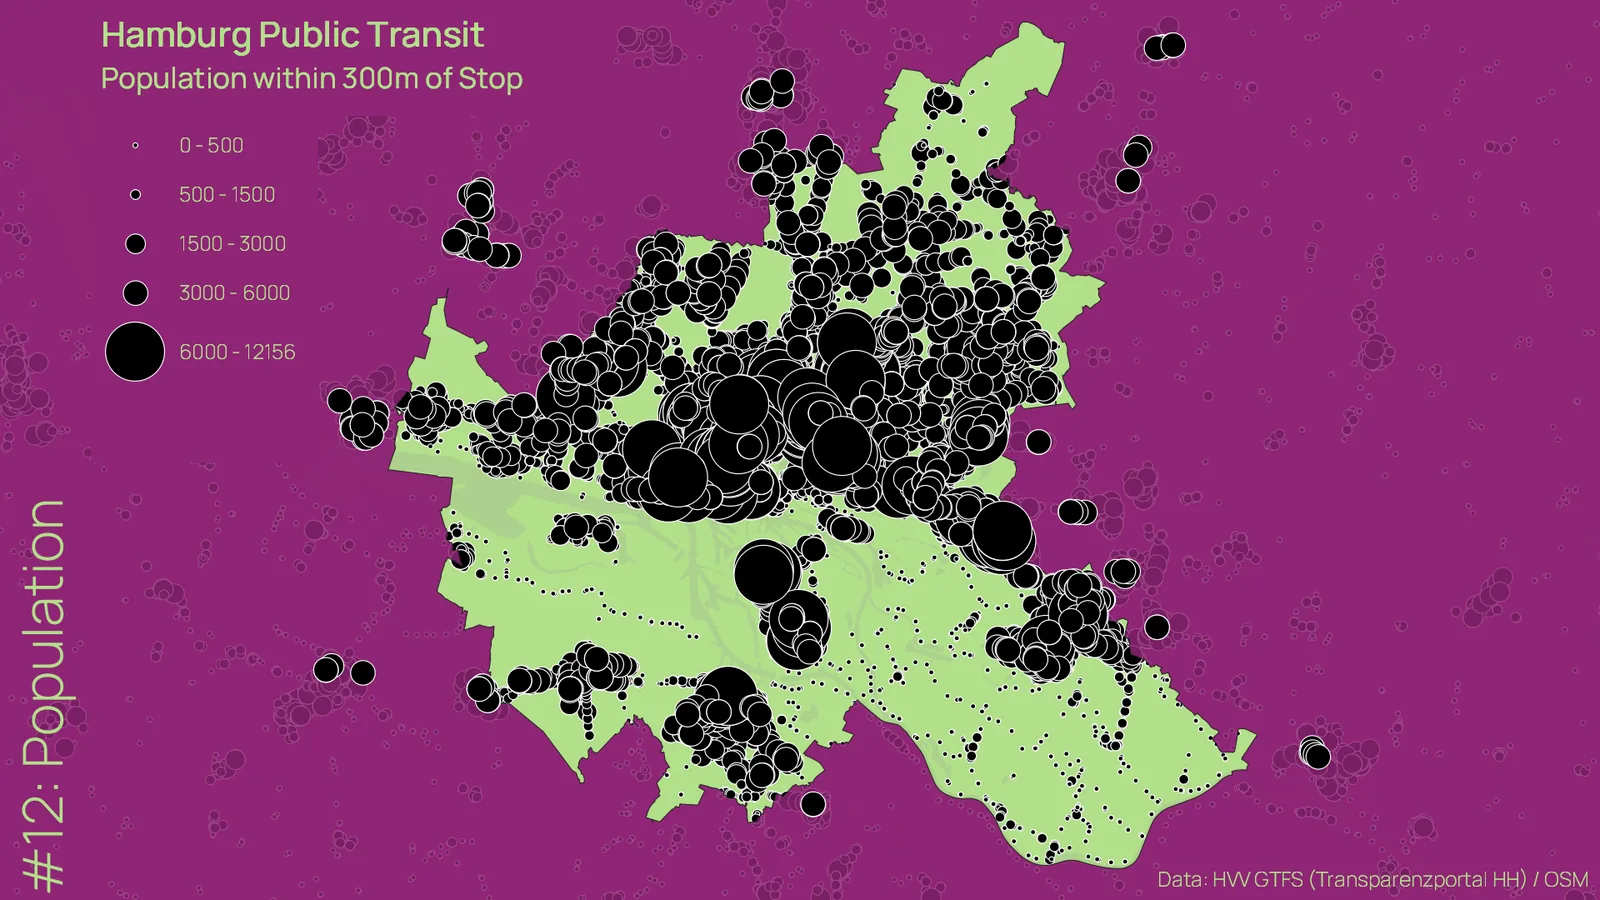
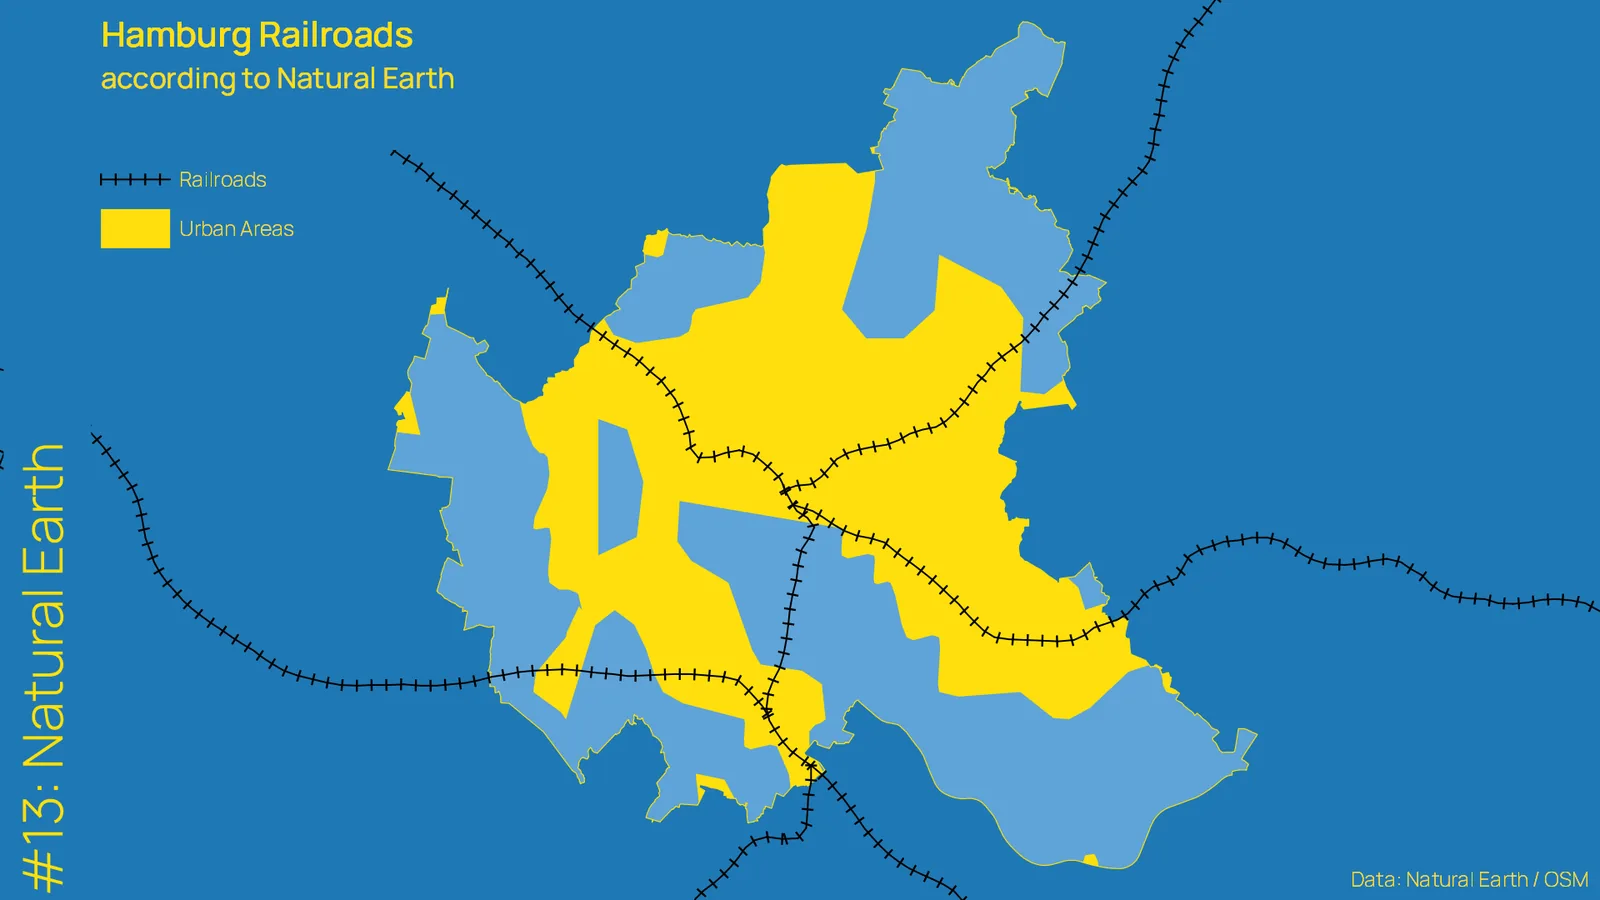
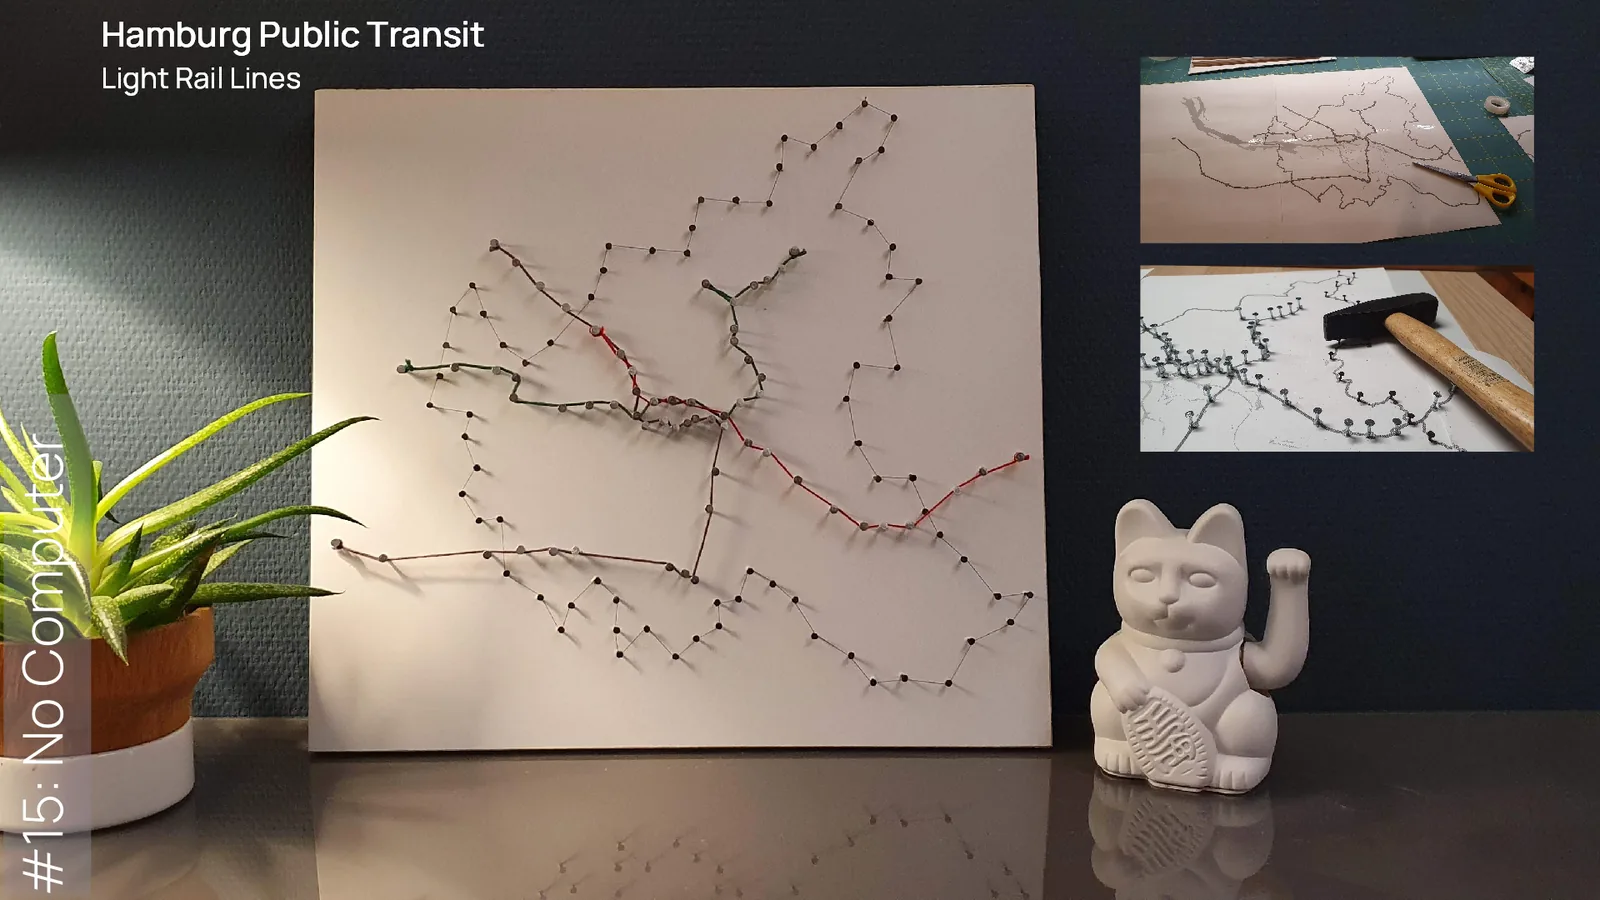
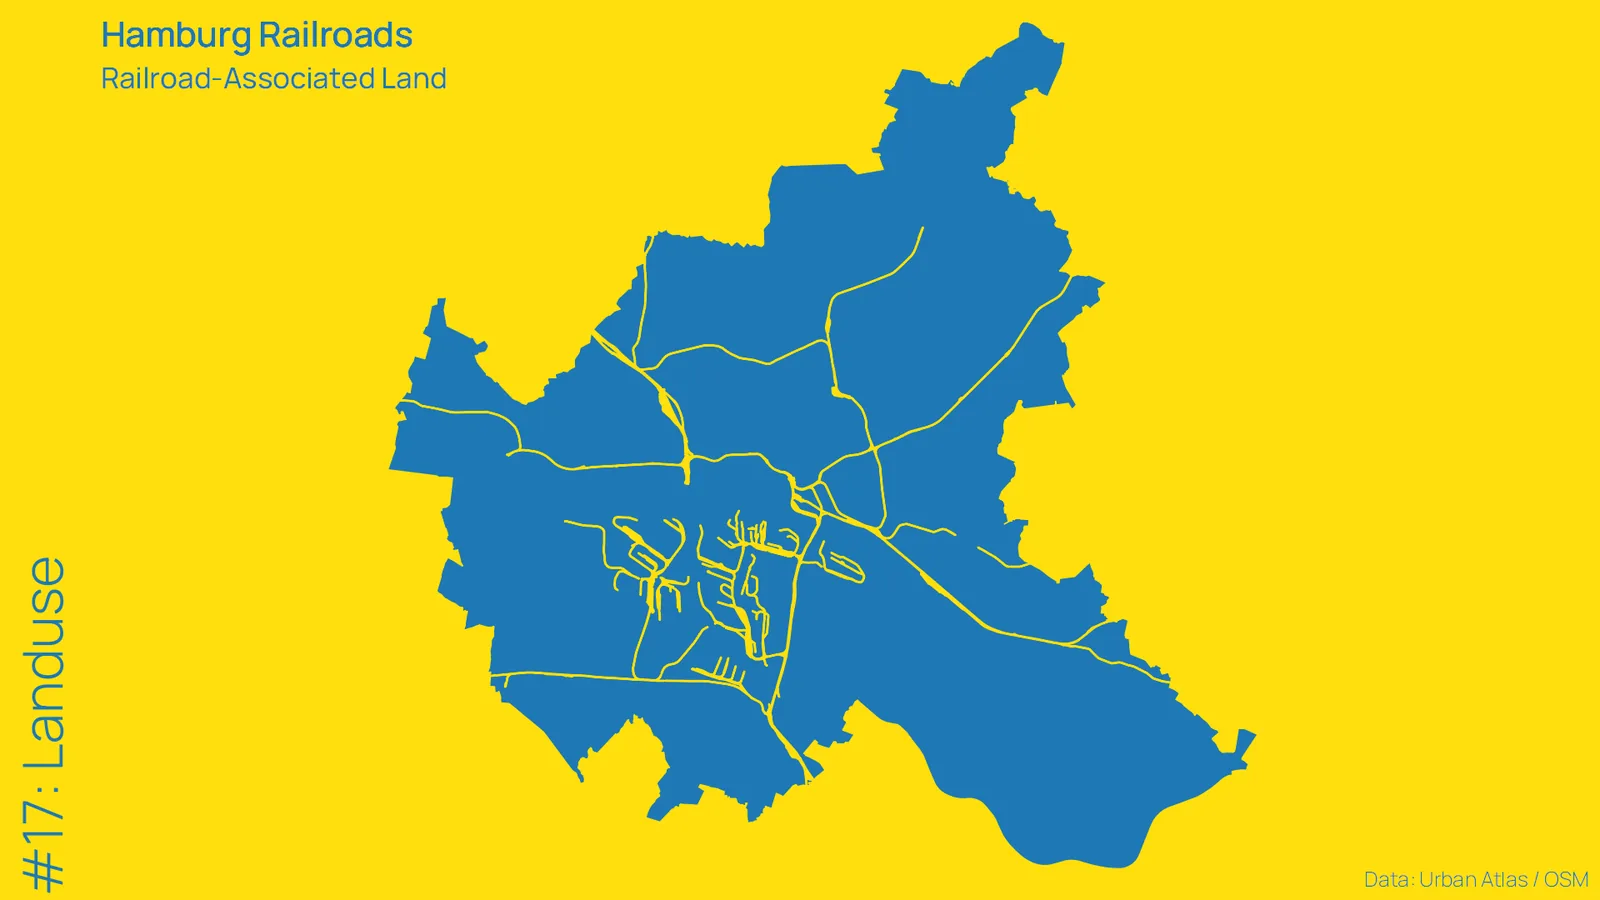
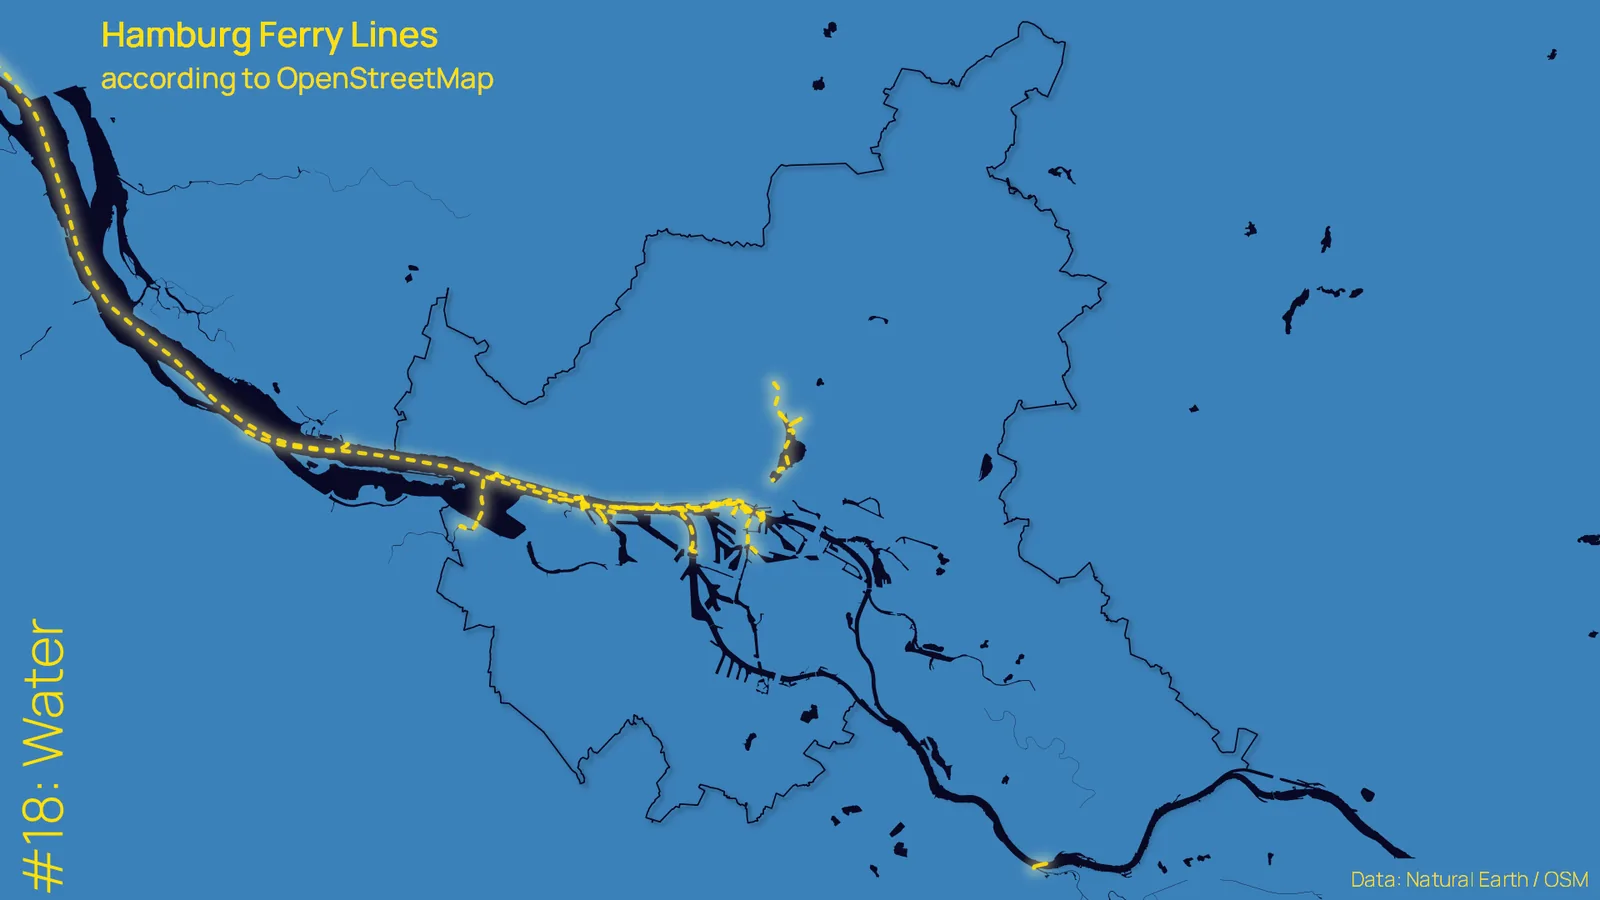
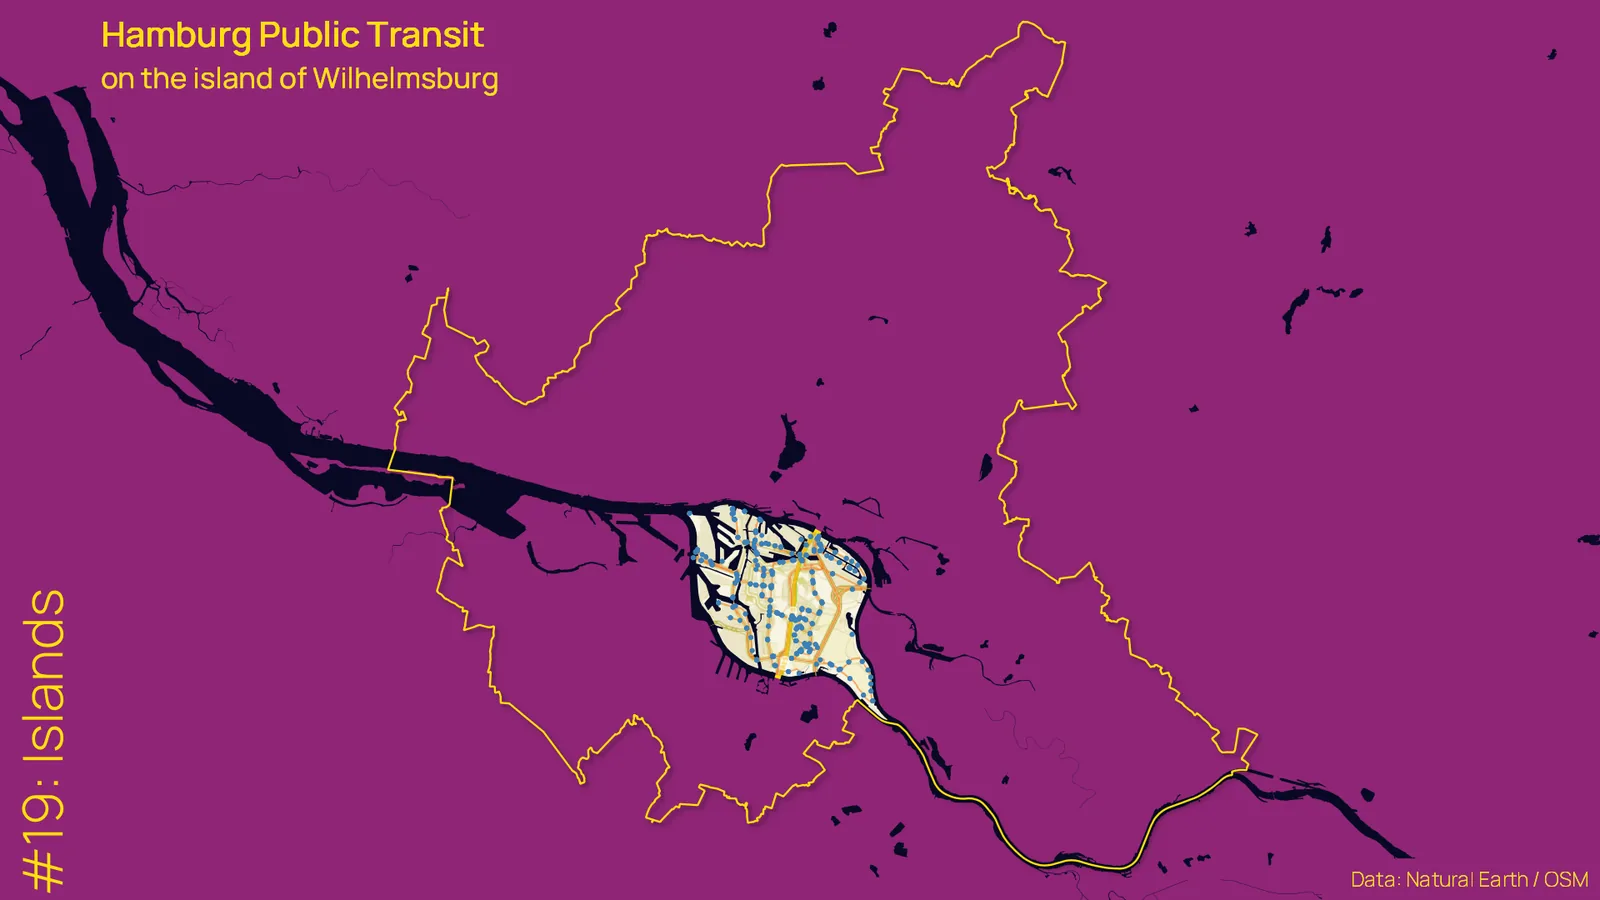
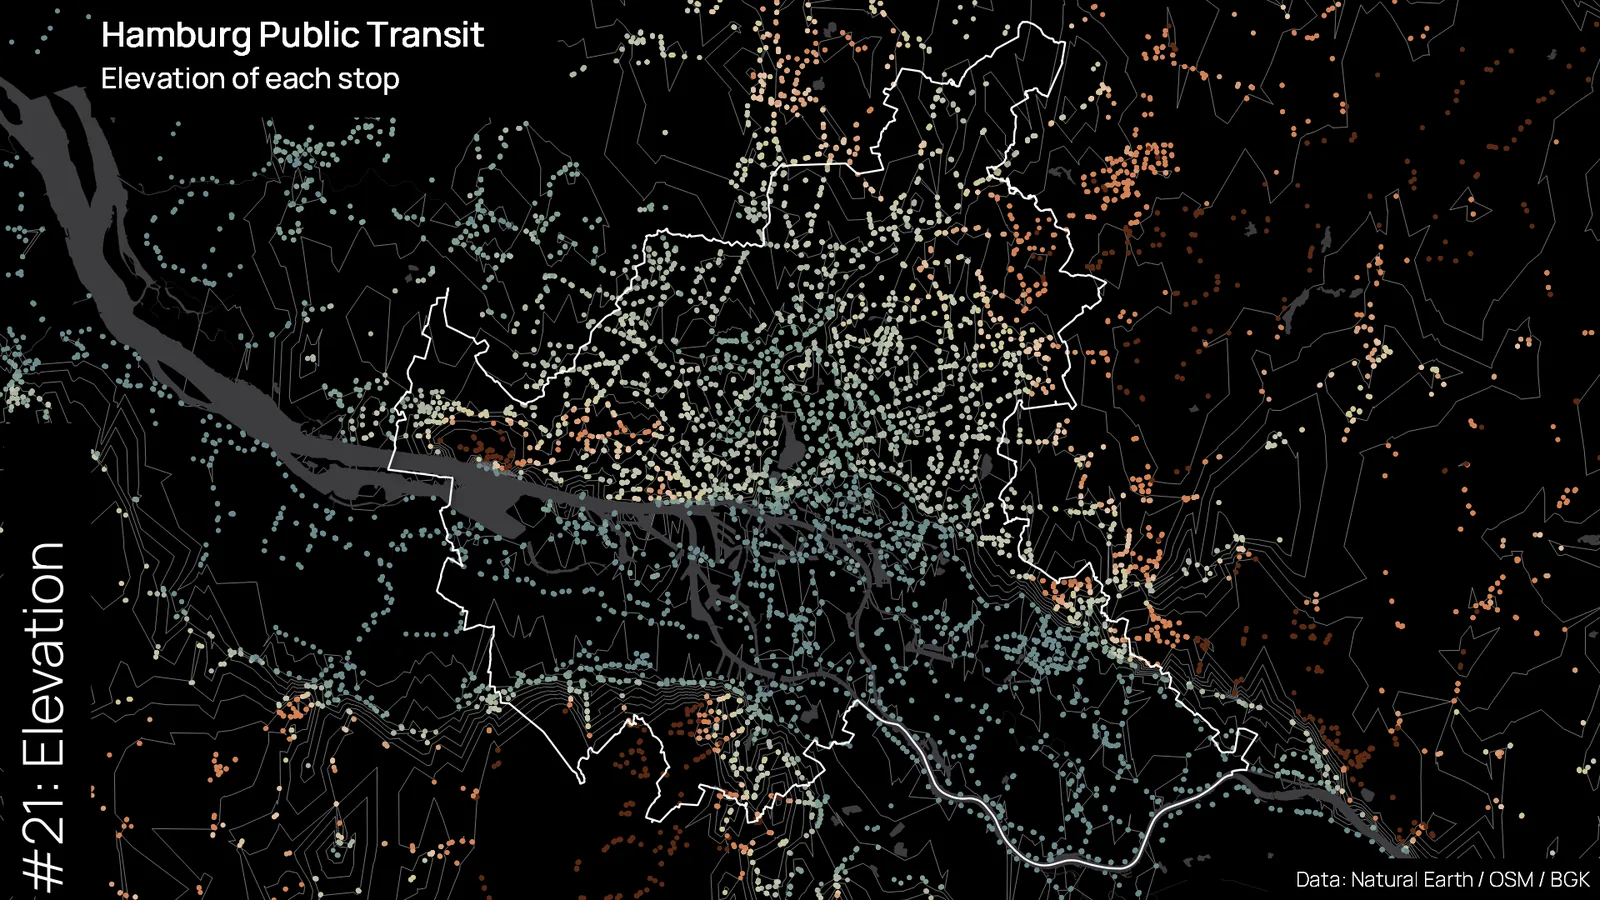
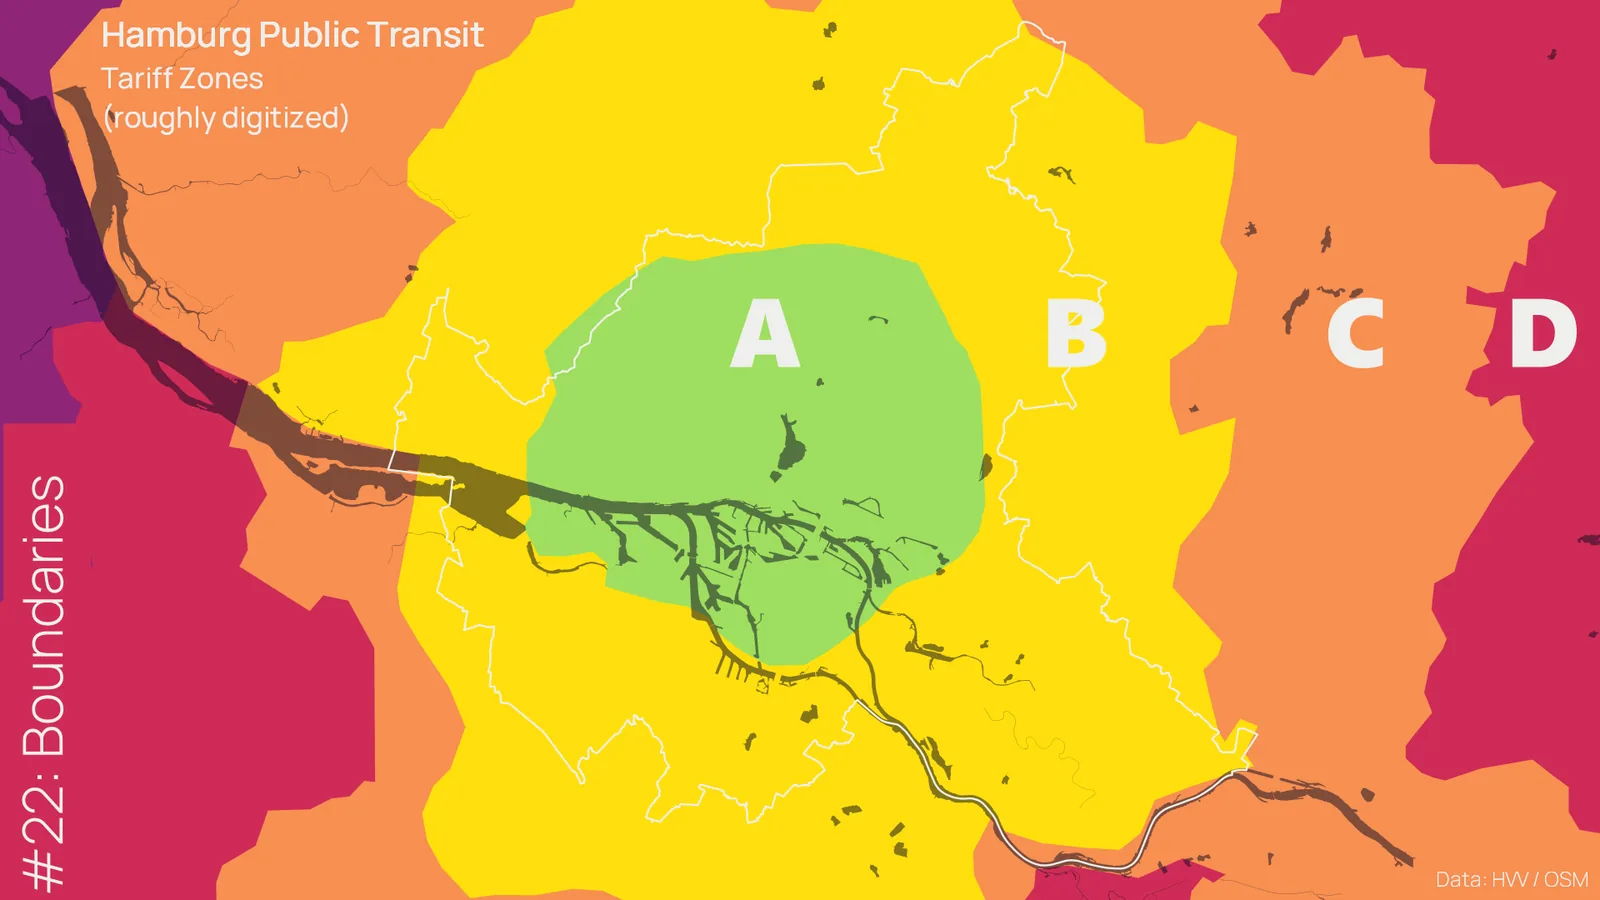
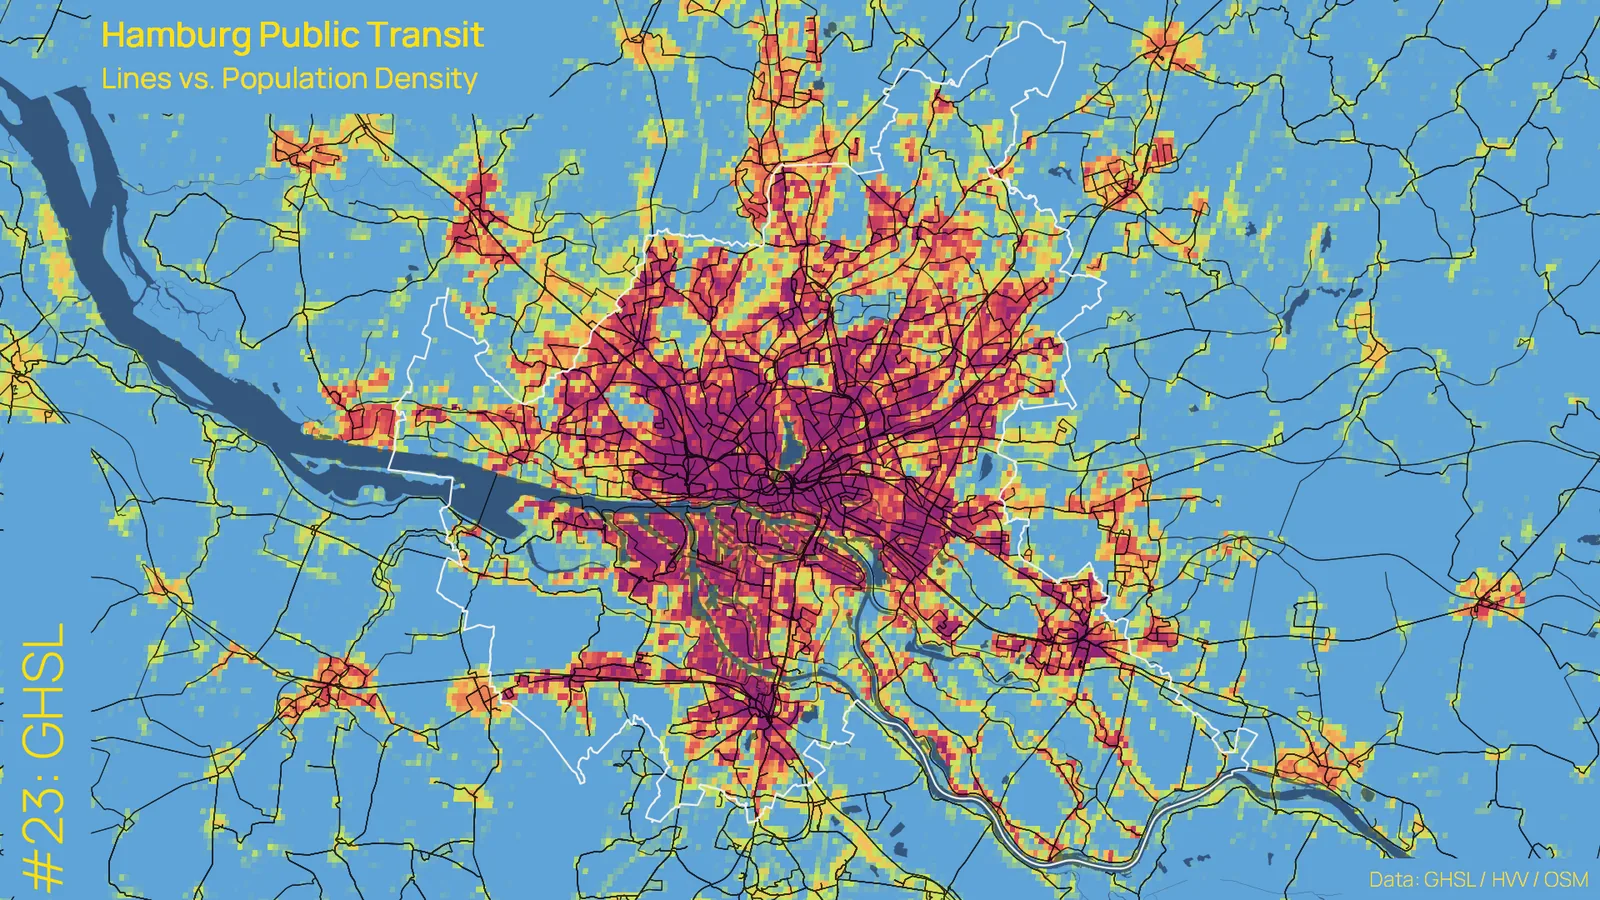
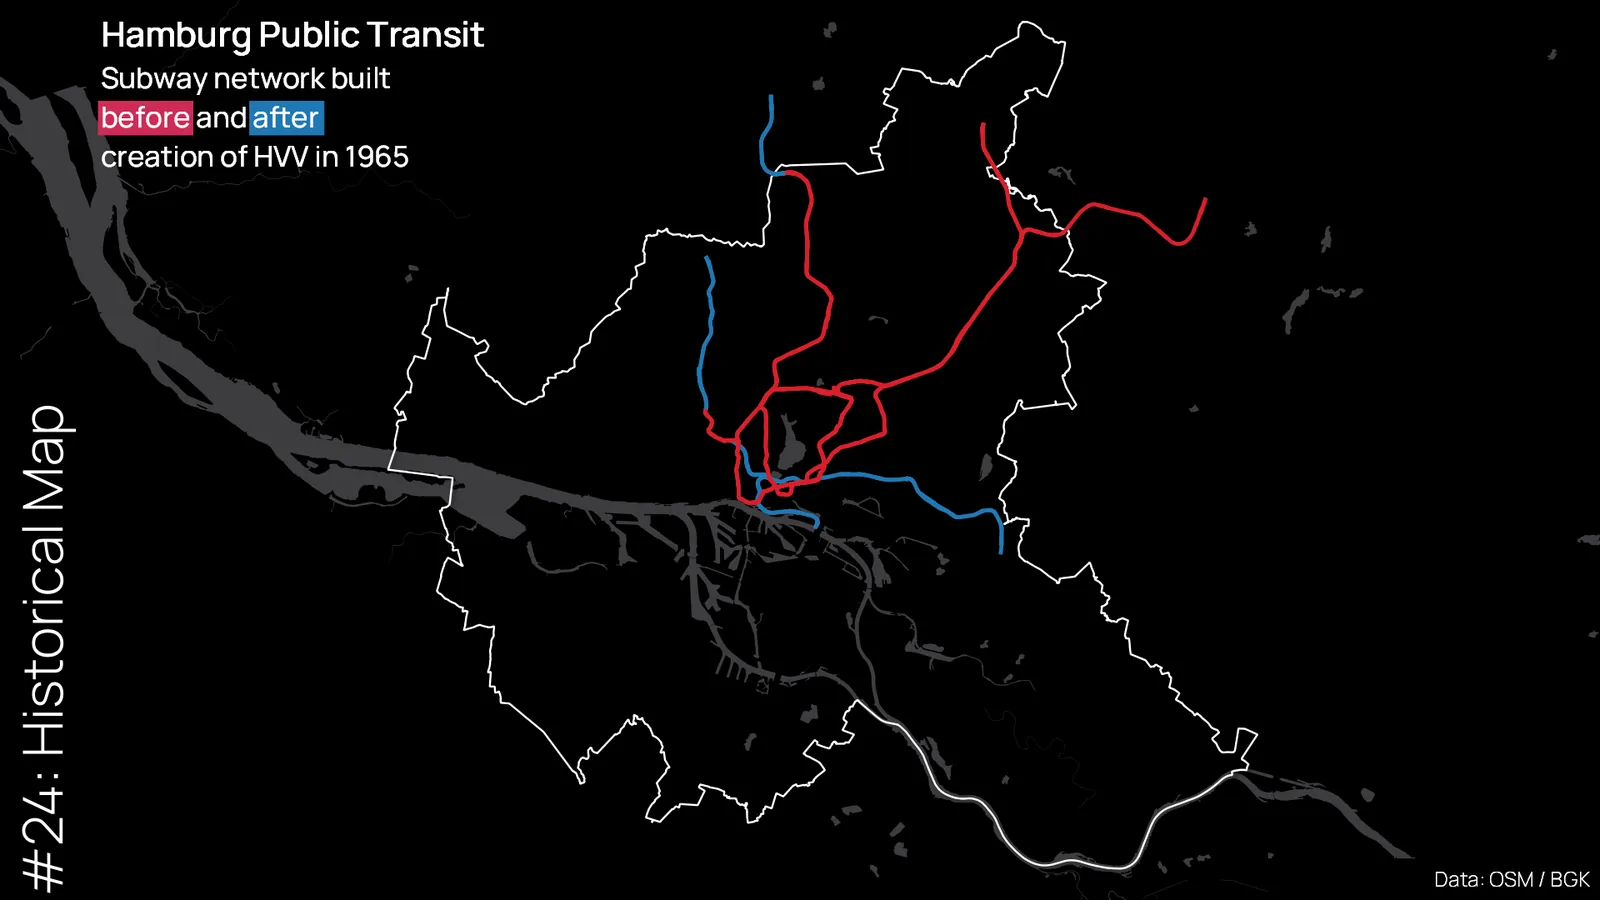
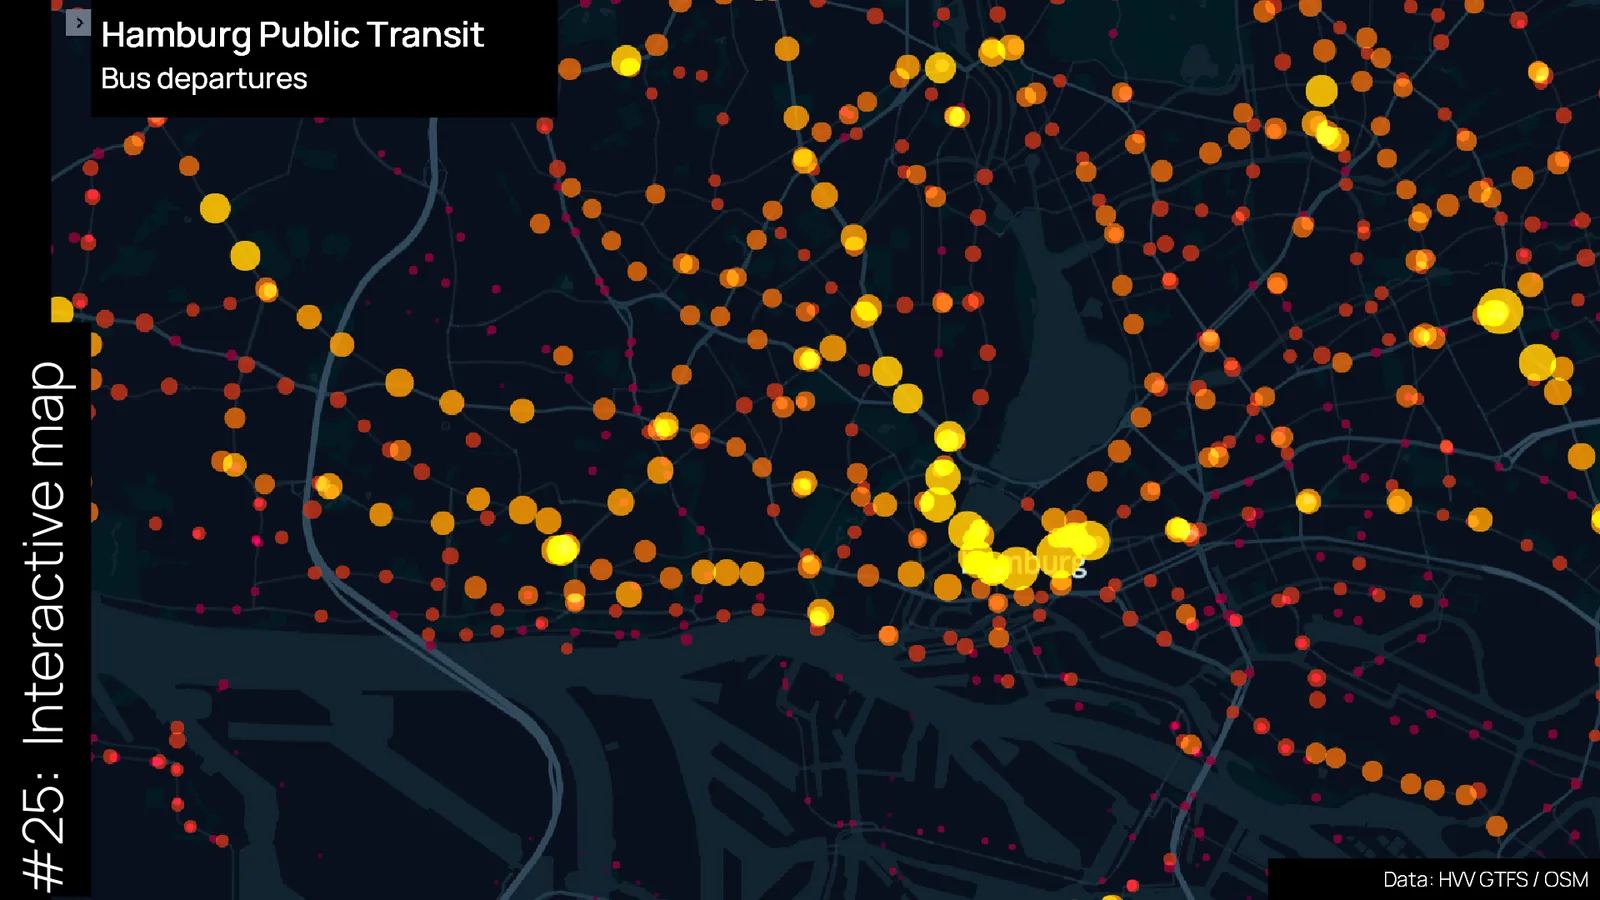
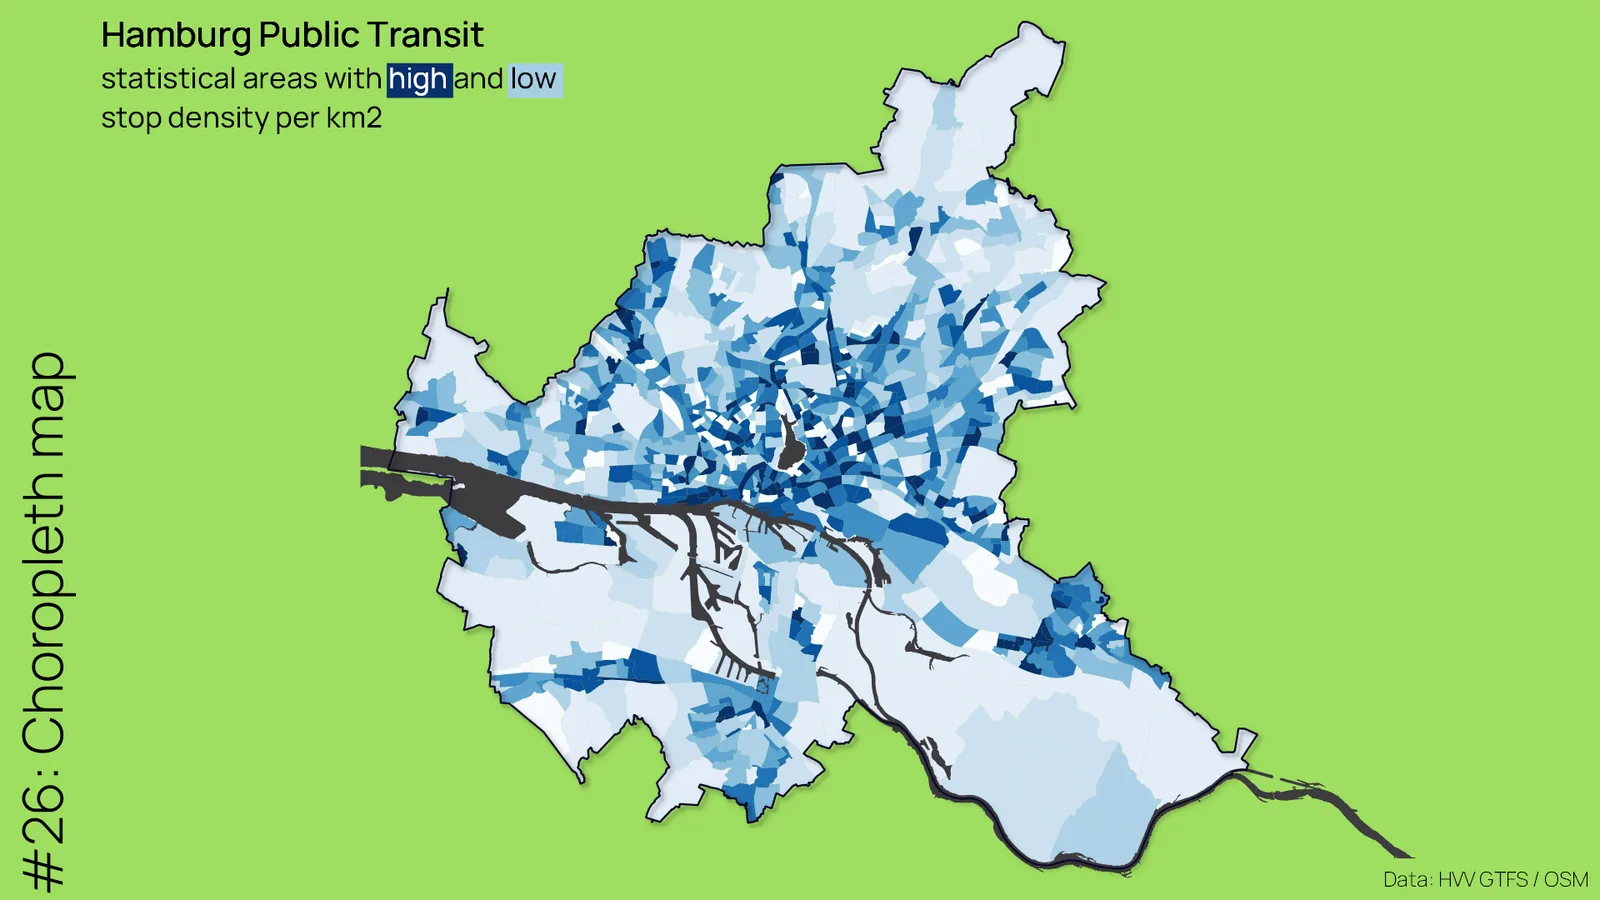
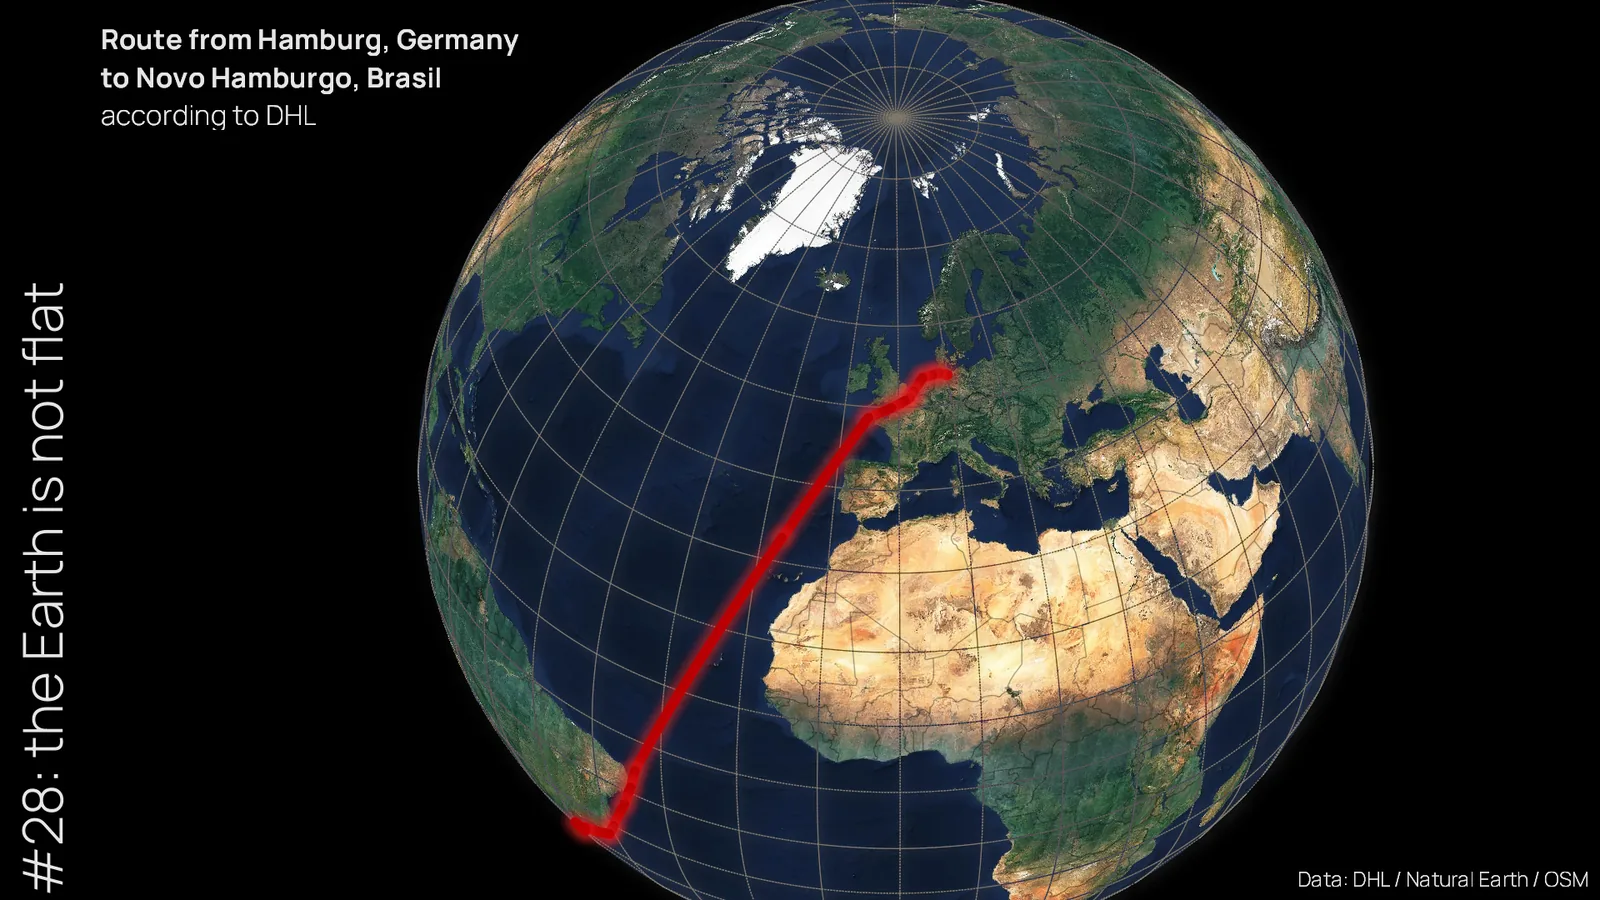
I had started working on some maps in the 2 weeks before the challenge so that I wouldn’t get too stressed out next to my regular job. Nevertheless, there were definitely some motivational dips during the challenge. This was due on the one hand to the insanely good quality of the other posts and on the other hand that especially towards the end of the challenge the punctual posting every day became a burden and at the same time I did not want to give up the streak.
Twitter impressions of my map posts
Looking back, however, I have to say that I am quite satisfied with the results. Since I’m not only interested in the maps, but also in data, I took a look at the impressions of the tweets over time. My posts had a median reach of about 800 views and I’m quite happy about that. Looking at the data, it seems to me that next year I should try a complete challenge with maps without a computer.